
The State of South Korean Manufacturing Market Research Report
1. Industry Overview and Executive Summary
South Korean manufacturing is still one of the most concentrated and strategically important industrial systems in the world. South Korea’s manufacturing industry doesn’t just make things. It anchors exports, absorbs capital investment, shapes foreign policy choices, and quietly determines whether the broader economy feels confident or fragile in any given year.
What makes South Korea different isn’t just scale. It’s how tightly the system is wired together. Semiconductors feed electronics. Electronics drive precision components. Precision components rely on advanced materials and industrial gases. Shipbuilding, autos, chemicals, and batteries share labor pools, ports, energy infrastructure, and suppliers. When one segment accelerates, the ripple effects show up across South Korean supply networks and across the broader manufacturing operations footprint. When one stalls, the stress does too.
Size, growth, and macro outlook
By most international benchmarks, South Korea remains unusually manufacturing-heavy, which matters for economic growth.
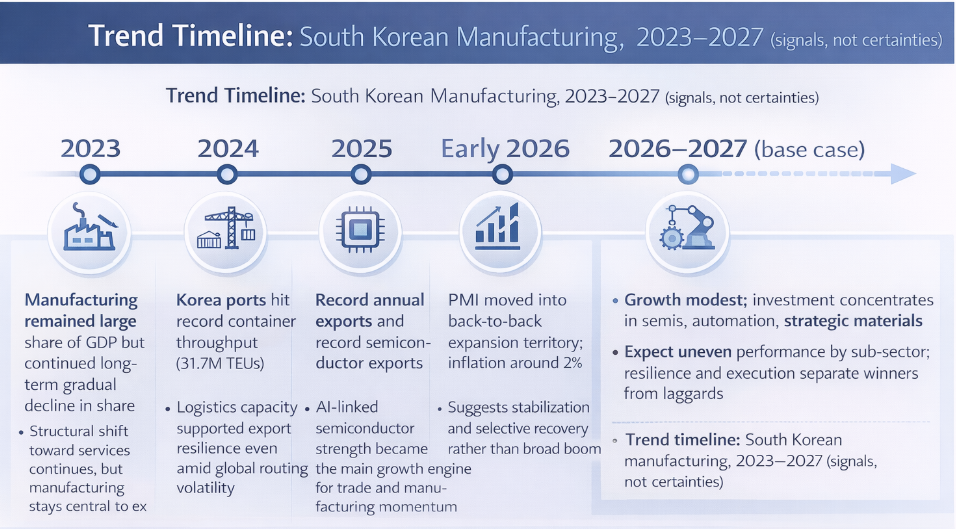
In 2023, manufacturing value added was roughly $416 billion, accounting for about 24.3 percent of GDP. That share has drifted down from its peak above 28 percent in the early 2010s, but it remains far higher than in most advanced economies, where manufacturing often sits closer to the mid-teens as a share of GDP. That concentration also means Korea’s policymakers pay close attention to added value, not just volume, because the most durable gains come from higher-margin exports and differentiated capabilities (TheGlobalEconomy / World Bank data)
This matters for two reasons. First, it means manufacturing production cycles still dominate Korea’s overall growth profile. Second, it makes South Korea extremely sensitive to global trade, technology cycles, and supply chain disruptions, especially volatility in energy inputs and raw materials.
Exports remain the clearest real-time signal of manufacturing health. In 2025, South Korea posted a record $709.7 billion in exports, with semiconductor exports alone reaching $173.4 billion, also a record. The strategic question is whether that export strength translates into added value across more of the supply base, or stays concentrated in a narrow set of winners. (Wall Street Journal)
That headline number masks volatility underneath. Manufacturing PMI data through late 2025 showed contraction, reflecting weak global demand outside semiconductors. Early 2026 readings, however, pointed to a tentative return to expansion, suggesting the sector may be stabilizing rather than accelerating. Sources: S&P Global PMI; Trading Economics
(S&P Global PMI, Trading Economics)
The macro outlook, in short, is uneven but not pessimistic. Korea is no longer in a broad-based manufacturing boom, but it is also not deindustrializing. Instead, output, capital, and talent are concentrating more heavily into fewer, higher-stakes segments.
Key drivers of industry growth
Three forces are shaping the current phase of Korean manufacturing. The common theme across all three drivers is positioning for the next generation of industrial competitiveness, not simply extending the last cycle.
First, the AI-led semiconductor cycle. Demand for high-bandwidth memory, advanced logic, and packaging tied to AI servers has lifted not only chipmakers but also upstream suppliers of materials, gases, equipment, and testing services. This has become the single most powerful growth engine in the manufacturing ecosystem.
Second, industrial policy and strategic alignment. Korea has expanded financial and regulatory support for sectors viewed as nationally critical, particularly semiconductors, advanced manufacturing equipment, and clean-energy-related industries. These policies are not just defensive; they are designed to anchor future investment decisions at home rather than offshore. (AP News)
Third, automation as a structural necessity. Labor availability is tightening, manufacturing employment as a share of total employment has been falling, and factories are responding by pushing automation deeper into production, inspection, and logistics. Korea is already among the most robot-dense manufacturing economies globally, and that trend continues. (International Federation of Robotics)
Cross-functional snapshot: finance, marketing, and operations
From a finance perspective, manufacturing groups are becoming more selective. Capital is flowing toward assets that protect supply chains or unlock bottlenecks rather than toward broad capacity expansion. M&A activity increasingly reflects portfolio reshaping instead of empire-building.
From a marketing perspective, the buying process has shifted permanently. Even for complex, high-value industrial purchases, buyers now expect to research independently, compare suppliers digitally, and engage sales teams later in the process. This has raised the bar for technical content, transparency, and responsiveness, while quietly lowering tolerance for generic outreach. (McKinsey & Company)
Operationally, resilience has become as important as efficiency. Logistics disruptions, energy price swings, and geopolitical risks have pushed manufacturers to rethink sourcing, inventory buffers, and port reliance. At the same time, Korea’s port infrastructure has proven capable of handling rising volumes, with 2024 marking a record year for container throughput nationwide. (Korea.net)
Industry Snapshot Table
| Metric | Latest data point | What it tells you |
|---|---|---|
| Manufacturing value added | ~$416 billion (2023) | Size of domestic industrial output base; places Korea among the world’s most manufacturing-intensive advanced economies |
| Manufacturing share of GDP | 24.3% (2023) | Manufacturing remains structurally central to the economy despite gradual long-term decline from early-2010s peak |
| Total exports | $709.7 billion (2025 record) | Confirms manufacturing’s role as the primary growth and FX engine |
| Semiconductor exports | $173.4 billion (2025 record) | Single largest profit pool and strategic driver across the manufacturing ecosystem |
| National container throughput | 31.7 million TEUs (2024 record) | Indicates logistics capacity and resilience supporting export-led manufacturing |
| Manufacturing PMI trend | Contraction in late 2025; early expansion in early 2026 | Signals stabilization rather than broad acceleration across factories |
| Robot density in manufacturing | Among global leaders | Reflects automation as a structural response to labor constraints and cost pressure |
- Manufacturing value added and GDP share (World Bank data via TheGlobalEconomy):
https://www.theglobaleconomy.com/South-Korea/Share_of_manufacturing/ - Export totals and semiconductor exports (Wall Street Journal, citing Korean trade statistics):
https://www.wsj.com/economy/trade/south-koreas-exports-stronger-than-expected-in-december-set-annual-record-in-2025-5f3f69dd - Port throughput (Ministry of Oceans and Fisheries via Korea.net):
https://www.korea.net/Government/Briefing-Room/Press-Releases/view?articleId=7812&type=O - Manufacturing PMI (S&P Global and Trading Economics):
https://www.pmi.spglobal.com/,
https://tradingeconomics.com/south-korea/manufacturing-pmi - Robot density (International Federation of Robotics):
https://ifr.org/ifr-press-releases/news/global-robot-density-in-factories-doubled-in-seven-years
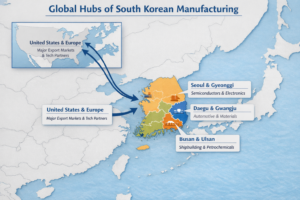
Global Hubs or Growth Geographies Map
2. Finance and Investment Landscape
South Korean manufacturing finance has entered a more selective phase. Capital is still flowing in South Korea, but the logic has changed. Instead of broad capacity expansion, most serious money is now chasing control points in the value chain: bottlenecks, critical inputs, and assets that protect continuity when cycles turn or geopolitics intervene.
This shift shows up clearly in M&A patterns, funding choices, and how manufacturing companies think about unit economics. In practice, the winners are not the firms chasing “growth for growth’s sake,” but the ones building durability: contractual coverage for raw materials, redundant suppliers, inspection capacity, and balance-sheet flexibility that keeps manufacturing operations stable under stress. That approach matters because in a manufacturing-heavy economy like South Korea, volatility hits economic growth faster and harder than it does in services-led markets. In this phase, capital discipline is less about starving growth and more about protecting added value while building the operational flexibility to reduce costs when demand softens.
Recent M&A activity: what’s actually being bought
Manufacturing M&A in Korea over the last 12 to 18 months has been less about consolidation for scale and more about securing strategic leverage.
One clear theme is upstream control.
A flagship example is Air Liquide’s agreement to acquire DIG Airgas, a leading industrial gas supplier in South Korea, from Macquarie Asset Management. The deal, announced in August 2025, valued the business at roughly €2.85 billion (about KRW 4.6 trillion). Industrial gases are essential inputs for semiconductor and advanced manufacturing processes, and capacity constraints can halt entire fabs. Acquiring an established operator is faster and lower risk than building greenfield infrastructure.
(Air Liquide)
Another recurring theme is battery and materials restructuring.
Group14 Technologies closed a $463 million Series D round in 2025 and simultaneously moved to acquire full ownership of a battery active materials factory in South Korea that had previously been structured as a joint venture with SK. While not a classic M&A transaction in the traditional sense, the move reflects the same motivation: tighter control over IP, production, and customer qualification in a strategically sensitive segment. (PR Newswire)
At a larger geopolitical scale, Korean manufacturers are also investing abroad to de-risk future access to markets. Korea Zinc’s announced $7.4 billion investment plan for a US-based critical minerals processing facility illustrates how capital allocation decisions are now shaped as much by policy alignment as by near-term returns. (Financial Times)
Deal Table
| Buyer | Seller / Asset | Segment | Announcement date | Disclosed value | Strategic rationale |
|---|---|---|---|---|---|
| Air Liquide | DIG Airgas (South Korea), from Macquarie Asset Management | Industrial gases | August 2025 | €2.85B enterprise value | Secures critical gas supply for semiconductors and advanced manufacturing; faster and lower risk than greenfield expansion |
| Group14 Technologies | Battery active materials factory (formerly JV with SK) | Battery materials | August 2025 | $463M Series D; acquisition value not directly comparable | Consolidates IP, production control, and customer qualification in a strategic battery segment |
| Korea Zinc | US-based critical minerals processing facility (greenfield) | Critical minerals / materials | 2024–2025 (announced) | ~$7.4B planned investment | Reduces geopolitical risk and aligns supply chain with US industrial policy |
Investment trends: PE, VC, and strategic capital
Private equity activity in Korean manufacturing has cooled compared with the pre-2022 environment, but it hasn’t disappeared. It has simply narrowed its focus.
What PE funds still like:
• Asset-heavy businesses with stable, contracted cash flows
• Suppliers embedded in long-term OEM relationships
• Carve-outs where operational improvement and pricing discipline can lift margins
What PE is more cautious about:
• Highly cyclical commodity exposure without pricing power
• Businesses dependent on a single end-market cycle (for example, pure-play memory suppliers)
Venture capital has largely shifted upstream and sideways. Instead of betting on end-product manufacturers, VC dollars are flowing into:
• Advanced materials
• Manufacturing software and industrial AI
• Energy efficiency and process optimization tools
This reflects a belief that tooling, software, and materials monetize regardless of which OEM dominates the next cycle.
Revenue models and unit economics: how manufacturers really make money
One of the biggest mistakes in analyzing manufacturing finance is applying software-style metrics too literally. LTV, CAC, and margin profiles exist here, but they behave differently. The best operators treat unit economics as a lever to reduce costs without degrading quality, because margin durability is what ultimately supports economic growth in a manufacturing-heavy system.
Three dominant revenue models define Korean manufacturing economics.
High-volume OEM manufacturing (autos, electronics)
Margins are thin by design. Profitability depends on procurement discipline, yield, throughput, and scale. Marketing spend is minimal; sales costs are embedded in long-term contracts. Unit economics are won or lost on operational efficiency.
Qualified supplier model (components, specialty materials)
This is where economics get interesting. Once a supplier is qualified, switching costs are high. Customer lifetime value can be substantial, but customer acquisition cost is front-loaded in engineering, testing, and field support rather than advertising. Payback periods can be long, but retention is strong if execution is consistent.
Project-based manufacturing (shipbuilding, large industrial systems)
Cash flow behaves more like project finance than product sales. Milestone payments, working capital management, and backlog quality matter more than headline margins. A full order book can mask weak unit economics if cost controls slip.
Typical margin and health indicators (broad ranges, not promises)
Gross margins can range from single digits in commodity segments to 30 percent or more in specialty materials and equipment. Cash conversion cycles are often the hidden lever; best-in-class operators aggressively manage inventory, supplier terms, and customer payment schedules. Profitability volatility is normal, especially in export-heavy segments exposed to FX and global demand swings.
Financial health indicators to watch
Across Korean manufacturing, experienced operators tend to track a few indicators more closely than headline revenue growth.
- Order backlog quality, not just size
• Exposure to single customers or geographies
• Sensitivity to energy, raw materials, and logistics costs
• Capex intensity versus free cash flow generation
Burn rate and runway, in the startup sense, matter mainly for venture-backed materials and industrial software firms. For established manufacturers, liquidity and working capital flexibility are far more relevant than “runway” language.
Valuation context: EV multiples without the illusion
Valuation multiples in Korean manufacturing fluctuate widely across cycles, making point-in-time comparisons misleading.
Cyclical segments like memory semiconductors and petrochemicals often trade at compressed multiples during peak earnings, because markets expect normalization.
Backlog-driven sectors like shipbuilding are valued more on visibility and execution risk than on near-term margins.
Suppliers with embedded positions in strategic supply chains tend to command premium valuations due to perceived resilience.
The most useful financial lens here is not a single multiple, but how durable cash flows look under stress: demand slowdowns, logistics disruptions, or policy shifts.
Taken together, the finance and investment picture points to a manufacturing sector that is still attracting capital, but on tougher, more strategic terms. Money is no longer chasing growth for its own sake. It’s chasing control, resilience, and relevance.
LTV:CAC Ratio Chart
| Manufacturing business model | Typical LTV:CAC range | How value is created | Key risk to economics |
|---|---|---|---|
| Commodity components | 2x–4x | Volume, cost control, procurement efficiency | Price pressure, low switching costs |
| Qualified suppliers (specialty materials, critical components) | 4x–8x | Long qualification cycles and high switching costs create durable customer value | High upfront engineering and qualification cost |
| Engineered solutions and systems | 3x–6x | Large contract values and embedded service relationships | Customization creep and high service overhead |
- CAC in manufacturing is primarily engineering time, field support, and sales effort, not paid media.
- LTV depends heavily on retention, requalification barriers, and customer production lifecycles.
- Payback periods are often long but acceptable if contracts are stable and margins are protected.
- These ranges are directional benchmarks, not performance guarantees.
EV/Revenue + EV/EBITDA Multiples
| Manufacturing segment | Typical EV / Revenue | Typical EV / EBITDA | Primary valuation driver | Key risk factor |
|---|---|---|---|---|
| Semiconductors (memory, logic) | 2.5x–5.0x | 6x–12x (cycle-dependent) | Technology leadership, yield, cycle timing | Earnings volatility, capex intensity |
| Specialty materials & components | 2.0x–4.0x | 8x–14x | Qualification barriers, switching costs | Customer concentration |
| Automotive OEMs & Tier-1 suppliers | 0.6x–1.2x | 4x–8x | Scale, brand, global distribution | Margin pressure, EV transition costs |
| Shipbuilding & heavy industry | 0.5x–1.0x | 5x–9x (backlog-adjusted) | Order book visibility, execution quality | Cost overruns, delivery delays |
| Chemicals & petrochemicals | 0.7x–1.5x | 5x–10x | Feedstock advantage, cycle position | Commodity price swings |
| Industrial equipment & machinery | 1.5x–3.0x | 7x–13x | Aftermarket revenue, service attach | Capex cycle exposure |
- Multiples vary sharply across cycles; peak earnings often coincide with compressed EV/EBITDA.
- Backlog-driven sectors (e.g., shipbuilding) are often valued on forward visibility rather than trailing margins.
- Segments with qualification lock-in (specialty materials, components) sustain higher multiples through downturns.
- Revenue multiples matter more where margins are structurally volatile or temporarily depressed.
3. Marketing Performance and Trends
Marketing in South Korean manufacturing has quietly changed more in the last five years than in the previous twenty. Not because factories suddenly care about branding, but because buyers do. In South Korea, procurement teams, engineers, and operations leaders now behave like modern B2B consumers: they research first, compare independently, and only talk to sales when they believe a supplier is credible.
That has pushed manufacturing companies to rebuild marketing around proof, not persuasion. The best-performing programs don’t lead with slogans — they lead with specs, test data, certifications, lead-time clarity, and traceability across the manufacturing process. In other words, marketing is now part of qualification, not just awareness.
For South Korean exporters, this shift has reshaped channels, messaging, and what “good marketing performance” even means in an industrial context.
Channel breakdown: where demand really comes from
Manufacturing demand generation is still relationship-driven, but the entry point into those relationships has moved upstream and online.
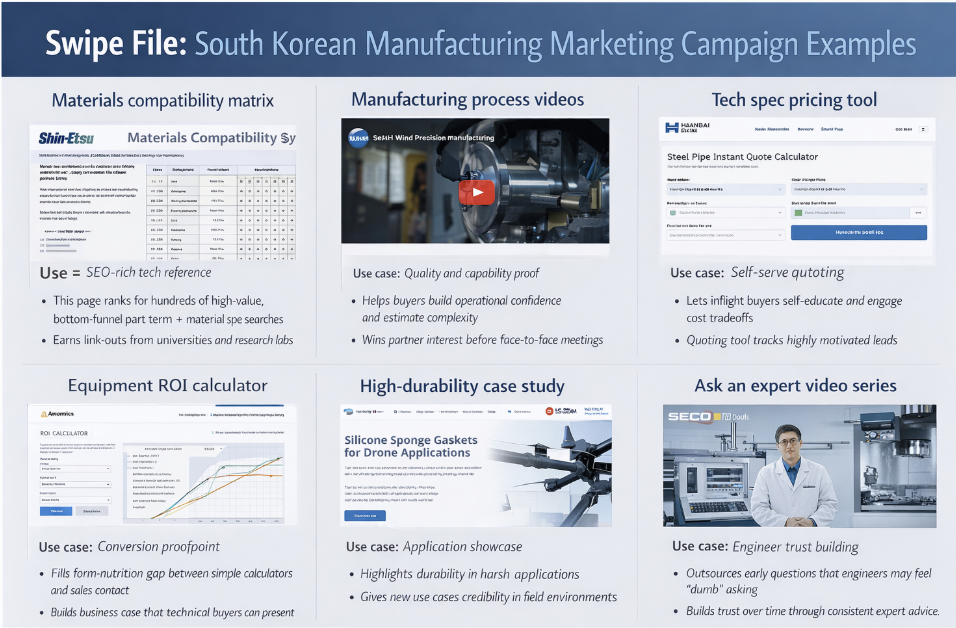
SEO and technical content
For most manufacturers, this is now the highest-ROI channel over time. Buyers search for part numbers, material specs, substitutes, compliance documents, and lead-time information long before contacting a supplier. Strong technical pages, CAD downloads, and application notes often generate fewer leads than paid channels, but the leads they do generate are far more qualified.
Paid search and LinkedIn
These channels work best when tightly constrained. Paid search performs well for replacement parts, urgent sourcing needs, and niche specifications. LinkedIn works when targeting specific job roles at known accounts, especially for capital equipment or engineered solutions. Broad awareness campaigns tend to waste spend.
Distributors and reps
Still the backbone of industrial sales, especially outside Korea. However, their effectiveness now depends on how well they are digitally enabled. Distributors who can surface real-time inventory, lead times, and documentation outperform those relying purely on relationships.
Trade shows and industry events
Events remain critical for large contracts and long sales cycles, but performance has polarized. The best companies treat events as qualification and trust-building moments, not lead-harvesting exercises. The worst still collect badges and never follow up.
Email and account-based outreach
Email works when it’s tied to real operational value: updates on lead times, spec changes, new certifications, or process improvements. Generic newsletters are mostly ignored.
Multi-Channel Performance Table
| Channel | Primary role | Typical performance signal | Common pitfall |
|---|---|---|---|
| SEO & technical content | Early-stage discovery and qualification | High-quality RFQs; higher conversion to quote; longer but cleaner sales cycles | Content reads like a brochure instead of answering technical questions |
| Paid search | Capture urgent/niche intent (replacement parts, spec-driven searches) | High-intent inbound leads; strong lead-to-quote rate when well-filtered | Poor filtering attracts students, competitors, and low-fit inquiries |
| LinkedIn (ABM) | Targeted access to known accounts and decision-makers | Meeting-to-opportunity rate; account engagement from priority roles | Overly broad targeting burns budget with low relevance |
| Distributors / reps | Geographic coverage, local trust, service capacity | Revenue per territory; margin by channel; repeat order rate | Channel conflict, pricing leakage, inconsistent messaging |
| Trade shows & industry events | Qualification and trust-building for large/complex deals | Pipeline influenced; progression of strategic accounts post-event | Badge scans without follow-up process or clear account priorities |
| Email & account-based outreach | Retention, expansion, and reactivation of dormant accounts | Repeat orders; expansion revenue; response rate from priority accounts | Generic newsletters and irrelevant outreach get ignored |
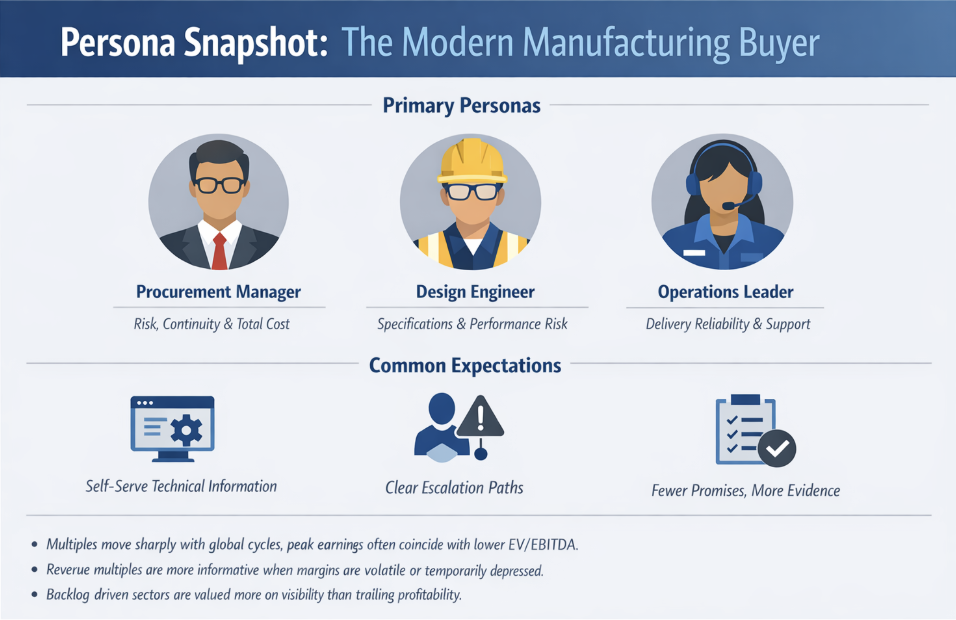
Buyer behavior trends: how decisions are made now
The modern industrial buyer looks very different from a decade ago.
Research before contact is now the norm. Multiple studies show that B2B buyers complete a majority of their evaluation digitally before speaking with sales. McKinsey reports growing comfort with remote and self-serve purchasing, even for high-value transactions. (McKinsey & Company)
Preference for low-friction buying. Gartner research shows that many B2B buyers actively prefer rep-free or rep-light purchasing experiences, especially in early stages. At the same time, buyers strongly avoid suppliers who push irrelevant or generic outreach. (Gartner)
Decision triggers that actually convert:
• Clear proof of technical fit
• Confidence in lead times and delivery reliability
• Evidence of quality control and compliance
• Risk reduction (second sourcing, contingency planning)
Marketing that fails usually fails because it ignores one of those.
Creative and messaging that performs best
In manufacturing, good marketing feels less like persuasion and more like reassurance.
What consistently works:
• Spec-first messaging: dimensions, tolerances, materials, certifications
• Process transparency: how defects are caught, how changes are controlled
• Operational proof: on-time delivery data, yield improvements, case examples
• Plain language: fewer slogans, more facts
What underperforms:
• Vague claims about “innovation” without specifics
• Brand videos that show factories but explain nothing
• Buzzwords borrowed from software or consumer marketing
The strongest campaigns often look boring at first glance. They win because they remove doubt.
Market positioning and brand perception
For Korean manufacturers selling globally, brand perception is closely tied to three attributes:
Reliability
Buyers associate Korean manufacturing with strong execution, particularly in electronics, autos, and materials. Missed deliveries or quality issues damage trust faster than in lower-cost regions because expectations are higher.
Technical competence
Korean suppliers are often perceived as more technically capable than low-cost competitors, but less flexible than some Western niche players. Marketing that highlights engineering depth helps reinforce this advantage.
Responsiveness
Speed matters. Buyers increasingly equate fast, clear responses with operational maturity. Slow quoting or vague answers can undo otherwise strong positioning.
A subtle but important shift is happening here. As more buyers discover suppliers digitally, first impressions are formed by websites, documentation, and response time, not by sales meetings. Marketing now sets the credibility floor.
Persona Snapshot
Swipe File: Campaign Examples
4. Operational Benchmarking
Operations are where South Korean manufacturing either quietly wins or painfully leaks value. Over the past few years, the conversation in South Korea has shifted from pure efficiency to resilience: how fast a plant can adapt when labor tightens, logistics break, or customers suddenly pull demand forward.
Supply chains are still global. Execution, however, is increasingly local and tightly controlled. The companies outperforming peers treat manufacturing operations as a commercial asset, not a back-office function, because reliability, lead-time honesty, and defect prevention now shape retention and pricing power. This is increasingly next generation operations work: standardize what can be standardized, automate what can be automated, and use data to reduce costs without increasing risk.
Inside production facilities, the operational edge is coming from targeted technology adoption rather than experimentation. industrial robotics and artificial intelligence are being deployed first where the economics are clearest: inspection, maintenance, yield stability, and high-variance steps in the manufacturing process. The objective isn’t flashy automation, it’s predictable manufacturing production when conditions aren’t predictable.
Supply chain and logistics
South Korean manufacturing remains deeply export-oriented, which makes logistics performance existential rather than tactical.
Ports and throughput
Korea’s port system is one of its biggest operational advantages. National container throughput reached a record 31.7 million TEUs in 2024, reflecting both strong export demand and the ability to absorb volatility without systemic congestion. Busan remains the dominant hub, handling the majority of transshipment traffic and acting as a regional gateway for Northeast Asia. (Korea.net)
Logistics disruptions and cost pressure
External shocks still matter. Red Sea shipping disruptions have lengthened Asia–Europe transit times and pushed some manufacturers toward rerouting or premium freight. These costs rarely show up immediately in margins but tend to surface later through missed delivery windows or strained customer relationships. (DHL Global Forwarding)
Nearshoring and dual sourcing
Rather than fully reshoring, most Korean manufacturers are pursuing selective redundancy. Common patterns include:
• Dual sourcing for critical components
• Regional buffer inventory near major customers
• Overseas processing or assembly tied to policy requirements (not cost savings alone)
The goal is not lowest cost, but fewer catastrophic failures.
Workforce structure and labor dynamics
Labor has become one of the tightest constraints in Korean manufacturing.
Employment trends
Manufacturing’s share of total employment has fallen to record lows, reflecting demographic pressure, aging workers, and declining interest among younger cohorts. This trend is structural, not cyclical. (Korea Pro)
Operational implications
Factories are responding in three ways:
• Automating repetitive and inspection-heavy tasks
• Redesigning roles to require fewer but more skilled operators
• Concentrating engineering and process expertise centrally rather than spreading it thin
Team composition
Typical advanced manufacturing sites now skew toward:
• Smaller headcount per line
• Higher technician-to-operator ratios
• Heavy reliance on maintenance, automation, and data specialists
Remote work remains rare on the factory floor but is more common in planning, engineering support, and procurement functions.
Technology stack: what’s actually used
Korean manufacturers are technologically advanced, but not experimental for the sake of it. Tools are adopted when they reduce downtime, defects, or labor intensity.
Core systems
ERP: SAP and Oracle dominate large enterprises; mid-sized firms often use local or hybrid ERP systems.
MES: Widely deployed, often heavily customized through local integrators.
PLM: Common in electronics, autos, and complex machinery, where configuration control is critical.
Quality and inspection
Machine vision and automated inspection are increasingly standard, especially in semiconductors, electronics, and battery manufacturing. AI-assisted defect detection is moving from pilot to production where yields justify the investment.
Connectivity and data
Factories increasingly rely on:
• Edge computing for latency-sensitive control
• OPC-UA and standardized protocols for equipment integration
• Private 5G pilots in large industrial complexes
Government-backed smart factory initiatives have accelerated adoption, particularly among SMEs that would otherwise struggle to fund upgrades. (Ministry of SMEs and Startups)
Fulfillment and customer service strategies
Operational excellence now extends beyond the factory gate.
Fulfillment
Best-in-class manufacturers track OTIF (on-time, in-full) obsessively and treat it as a commercial metric, not just an operations KPI. Lead-time transparency has become a competitive differentiator, especially for global buyers managing tight production schedules.
Customer support
Support teams increasingly handle:
• Technical questions before sale
• Process changes and requalification during production
• Issue resolution post-delivery
Some manufacturers are introducing AI-assisted support for documentation lookup and troubleshooting, primarily to reduce load on senior engineers rather than replace them.
Regulatory and compliance hurdles
Regulation increasingly shapes operations, even when it isn’t visible on the shop floor.
Export controls and technology restrictions affect:
• Equipment sourcing
• Customer qualification
• Data sharing across borders
Environmental and carbon reporting requirements are showing up more frequently in RFQs, audits, and long-term supplier agreements. Compliance is no longer just about avoiding penalties; it’s becoming a prerequisite for winning business.
Tech Stack Diagram

Ops KPI Table
| KPI | Discrete manufacturing (electronics, components) | Process manufacturing (chemicals, materials) |
|---|---|---|
| On-time, in-full (OTIF) | 85–98% (varies with demand volatility and component constraints) | 90–99% (strongest when feedstocks and energy inputs are stable) |
| Scrap / rework rate | 0.5–5% (rises with complexity and tighter tolerances) | Tracked as yield loss vs specification (often expressed as % off-spec or yield variance) |
| Inventory turns | 4–12 | 6–20 |
| Lead-time variability | Highly sensitive to component shortages, inspection bottlenecks, and changeovers | Highly sensitive to energy prices, feedstock availability, and continuous-process stability |
| Downtime impact | High impact on automated lines; downtime cascades into schedule and OTIF slippage | High impact in continuous processes; restarts can be costly and time-consuming |
5. Competitor and Market Landscape
South Korean manufacturing competition is easiest to understand as overlapping arenas, not one single “market.” Memory chips behave nothing like shipbuilding. Autos don’t look like petrochemicals. So instead of forcing one market share chart that would be misleading, this section maps the true battlegrounds by sub-sector, highlights who holds the profit pools, shows where challengers are pressing hardest, and which key sectors matter most for strategic positioning in South Korea. Two pressure points cut across multiple arenas: the steel industry as a foundational input and benchmark for heavy-industry health, and automobile manufacturing as a bellwether for export competitiveness and electrification cost curves.
At the top end, a small number of South Korean production facilities act like gravity wells. Their capex cycles shape upstream demand for materials, gases, tooling, and logistics capacity, and their quality expectations influence supplier qualification norms across the manufacturing industry.
At the same time, competitive pressure is intensifying in segments where scale and cost curves dominate. For many suppliers, the steel industry cycle affects pricing, lead times, and working capital, while automobile manufacturing increasingly determines the pace of tooling upgrades and the next generation of component qualification. In batteries and commoditized chemicals, China’s capacity and pricing posture compress margins. In heavy industry, swings in energy and raw materials costs reshape competitiveness quickly. In autos, the pace and cost of electrification changes the economics of automobile manufacturing and pushes continuous upgrades across plants and suppliers.
Top players and where they matter most
Semiconductors and electronics
Samsung Electronics and SK hynix are the gravity wells. They shape upstream demand (materials, gases, equipment) and downstream pricing dynamics across electronics exports.
In memory specifically, both companies are tied to the AI cycle through high bandwidth memory (HBM) and server DRAM. TrendForce notes Samsung maintained the leading position in DRAM during 2Q24, and provides quarter revenue figures showing Samsung and SK hynix as the dominant leaders by scale. (TrendForce)
In NAND, TrendForce reported Samsung leading with a 36.9% share (2Q24), with SK group next at 22.1% (and other major players including Kioxia, Micron, and Western Digital). (TrendForce)
Shipbuilding and offshore
Korea competes on complexity, not volume. The most durable moat is not “more ships,” it’s the ability to build and deliver high-spec vessels like LNG carriers and advanced offshore units with tight tolerance execution.
At the country level, Korea’s shipbuilding share rebounded meaningfully in 2025 in global ordering, with reporting citing Korea’s share rising to about 25.9% (with China still dominant but down from prior levels). (The Maritime Executive)
Key Korean champions here include HD Hyundai Heavy Industries / HD Korea Shipbuilding & Offshore Engineering, Hanwha Ocean, and Samsung Heavy Industries, with recent reporting also pointing to sharp profit rebounds tied to higher-margin LNG and defense-linked ship types. (Tradewinds News, UPI)
Automotive
Hyundai Motor Group (Hyundai + Kia) is Korea’s flagship scale player. What matters competitively is its manufacturing footprint (global plants), ability to flex mix (ICE, hybrid, EV), and supply chain localization.
Hyundai Motor reported 2024 global sales of about 4.14 million vehicles and set a 2025 target above 4.17 million, which frames its global scale and planning cadence. (Hyundai)
Batteries and battery materials
Korea’s “big three” battery makers (LG Energy Solution, SK On, Samsung SDI) remain globally important, but competition from China has been intense and market share has been under pressure.
SNE Research reported the combined global EV battery usage share of LG Energy Solution, SK On, and Samsung SDI at 18.4% for Jan–Dec 2024. (SNE Research)
Separate reporting, also citing SNE Research, described a further dip to around 16% combined share for Jan–Oct 2025. (Battery-Tech Network)
Chemicals and petrochemicals
This is where the competitive story is less “winner takes all” and more “who survives the downcycle best.”
Industry reporting described government-linked restructuring pressure on Korean petrochemical producers and highlighted multiple major firms (LG Chem, Lotte Chemical, SK geocentric, Hanwha Solutions, and others) involved in restructuring plans and capacity decisions. (Hydrocarbon Processing, Korea Joongang Daily)
Steel and industrial materials
POSCO remains the anchor name, with scale and export exposure, plus battery materials ambitions that tie back into the broader manufacturing ecosystem. POSCO’s 2024 performance release also frames the pressure points: oversupply and weaker demand weighing on steel profitability. (POSCO Newsroom)
Emerging startups and disruptors
In Korea, “disruptor” rarely means meaningfully replacing chaebol-scale incumbents in the near term. It usually means taking margin-rich slices around them:
Industrial AI and inspection
AI-assisted visual inspection, yield analytics, and predictive maintenance vendors that reduce defect escapes and downtime. These tools sell because they convert directly into yield and throughput.
Advanced materials and process IP
Battery materials (silicon anodes, recycling, electrolyte innovations), semiconductor materials, and specialty chemicals where qualification creates stickiness.
Digital procurement and quoting
Supplier portals, self-serve RFQ tooling, and lead-time transparency systems that reduce friction for buyers and reduce sales overhead for manufacturers.
Strategic differences in positioning, pricing, and business model
How Korean leaders typically win
High reliability and execution at scale (especially semis, autos, shipbuilding)
Deep process know-how and continuous improvement culture
Tight supplier ecosystems clustered around industrial hubs
Where challengers are attacking
Price and capacity (China in batteries and commoditized chemicals)
Policy-aligned localization (US/EU manufacturing requirements pulling investment abroad)
Niche specialization (smaller global players winning on flexibility and customization)
Competitive Matrix
| Segment | Korea’s typical positioning | Pricing posture | Differentiator that actually matters | Representative sources |
|---|---|---|---|---|
| Memory semiconductors | Premium performance plus scale; central in global supply chains | Mid-to-premium, strongly cycle-driven | Yield, node leadership, HBM capacity allocation | TrendForce DRAM ranking update |
| Shipbuilding and offshore | High-spec and complex vessels (e.g., LNG carriers); execution-led competition | Premium vs commodity yards when backlog is strong | Execution quality, backlog discipline, LNG/defense capability | TradeWinds: LNG and defense underpinning recovery, The Maritime Executive: Korea market share context |
| Automotive | Global scale with broad lineup; export and overseas production footprint | Competitive, margin-managed | Manufacturing flexibility, supply chain localization | Hyundai Motor: 2024 sales and 2025 targets |
| EV batteries | High quality with global OEM relationships; pressured by China scale | Under sustained pricing pressure | Chemistry roadmap plus cost curve; OEM qualification and reliability | SNE Research: global EV battery usage share (2024) |
| Petrochemicals | Scale producers operating in a challenging global cycle | Commodity-exposed | Feedstock economics, restructuring speed, capacity discipline | Hydrocarbon Processing: restructuring and production context |
SWOT-Style Summary of Top 5 Players
| Company | Strengths | Weaknesses | Opportunities | Threats |
|---|---|---|---|---|
| Samsung Electronics (manufacturing core: semiconductors, electronics) | Unmatched scale, deep process know-how, global customer reach; leadership in advanced memory and packaging | Highly cyclical earnings tied to memory markets; very high capex intensity | AI-driven HBM demand; advanced packaging and foundry ecosystem expansion | Intensifying competition from SK hynix and Micron; export controls and geopolitical risk |
| SK hynix (memory semiconductors, HBM) | Strong positioning in HBM and server memory; rapid upside leverage in cycle upturns | Narrower product focus increases cycle exposure; supply allocation tradeoffs | Sustained AI server demand; pricing power in premium memory segments | Sharp cycle reversals; technology export restrictions |
| Hyundai Motor Group (automotive manufacturing) | Global manufacturing footprint; ability to flex across ICE, hybrid, and EV platforms; strong supply chain control | Margin pressure from electrification transition; capital intensity | Scaling electrified and hybrid models; localized production in key markets | Aggressive pricing from Chinese OEMs; demand volatility; regulatory shifts |
| HD Hyundai Shipbuilding Group (shipbuilding & offshore) | Strength in complex, high-spec vessels; improving execution discipline and profitability | Project risk exposure; sensitivity to steel and labor costs | LNG carriers, offshore energy, and defense-linked ship demand | Order-cycle volatility; competition as global capacity adjusts |
| LG ecosystem (LG Chem & LG Energy Solution) | Deep materials science expertise; strong global OEM relationships | Market share pressure in batteries; margin compression | Higher-end chemistries; US/EU localized battery supply chains | China’s scale economics; rapid technology and policy shifts |
6. Trend Analysis and Forward Outlook
This is the section where the story stops being “Korea makes great stuff” and becomes “what’s likely to change the scoreboard next.” The big theme: South Korean manufacturing is still an export machine, but it’s operating in a world where macro swings, policy, and logistics shocks hit faster and harder than they used to. The winners won’t just be efficient. They’ll be fast, flexible, and annoyingly prepared.
The central tension is concentration. South Korea’s manufacturing sector is not broadly shrinking, but investment, talent, and strategic attention are narrowing into fewer, higher-stakes nodes: semiconductors, battery-related materials, precision components, and select heavy-industry niches. That concentration amplifies the upside in good cycles and magnifies risk when a single node stalls.
Over the next 12–24 months, expect more “resilience-first” decisions. That includes controlling bottlenecks in the manufacturing process, building redundancy in raw materials sourcing, and upgrading the execution layer inside production facilities using artificial intelligence and automation. The goal is steady manufacturing production even when demand signals and shipping routes are unstable because in a manufacturing-heavy economy like South Korea, that stability directly influences economic growth.
Macroeconomic factors: rates, inflation, growth, regulation
Rates and financing conditions
The Bank of Korea’s base rate has been held steady at 2.5% into early 2026 (per widely used macro trackers), reflecting a cautious stance as the central bank balances inflation, growth, and financial stability. This matters for capex-heavy manufacturers because even small shifts in rates change hurdle rates for expansion, automation, and inventory financing. (Trading Economics)
The Bank of Korea’s official policy framing for 2026 emphasizes continued data dependence and financial stability considerations, which signals that manufacturers should plan for a “no dramatic easing” baseline unless growth weakens sharply. (Bank of Korea)
Inflation and cost pass-through
Inflation eased to about 2.0% in January 2026, down from 2.3% in December 2025, suggesting cost pressure is calmer than it was during the peak inflation years. That’s helpful, but it doesn’t eliminate the real cost problem for factories: energy and logistics can still spike suddenly even when CPI looks tame. (Trading Economics)
Growth outlook
The IMF’s January 2026 outlook pegs Korea’s 2026 real GDP growth at about 1.9%. That’s not “boom,” but it is enough to support selective industrial expansion, especially where exports and AI-linked demand are strong. (IMF, The Korea Times)
Regulation and policy gravity
Strategic manufacturing policy continues to shape where money goes. Korea’s semiconductor support measures, and the broader global push to localize critical supply chains, are pulling investment toward semis, batteries, and strategic materials, and pushing firms to build redundancy even when it’s not the cheapest option. (The Korea Times, Bank of Korea)
Tech disruptions: AI, automation, and the next operational edge
AI is no longer a “nice to have” for manufacturing
Two changes are happening at once:
- AI demand is boosting the semiconductor cycle
S&P Global’s South Korea Manufacturing PMI commentary for early 2026 points to improving orders and production and notes back-to-back expansion readings above 50 for the first time since mid-2024. That is consistent with a manufacturing rebound led by stronger demand pockets rather than broad uniform strength. (S&P Global PMI) - AI inside the factory is moving from pilot to production
The most common high-impact uses in Korean plants right now:
Visual inspection and defect detection (especially electronics, batteries)
Predictive maintenance (reducing unplanned downtime)
Yield optimization (process drift detection, anomaly spotting)
Support automation (technical documentation search, troubleshooting triage)
Automation keeps rising because labor is tight
Robot density has been rising globally, and Korea remains one of the most automation-forward manufacturing economies. This isn’t about trendy tech. It’s an answer to labor availability, quality consistency, and throughput pressure. (S&P Global PMI, Trading Economics)
Consumer sentiment trends: what matters and what doesn’t
For manufacturing, “consumer sentiment” only matters indirectly. It shows up through:
- Auto demand (especially in export markets)
- Electronics replacement cycles
- Housing-linked durable goods demand
The more immediate driver of factory momentum is B2B ordering behavior, export conditions, and whether specific global cycles (AI infrastructure, EV demand, shipbuilding order books) are rising or stalling. Korea’s record 2025 exports and record semiconductor exports show how powerful one cycle can be when it’s hot. (S&P Global PMI, The Korea Times)
Predicted strategic moves in finance, marketing, ops
Finance: more resilience buying, fewer vanity expansions
Expect continued “control point” investment:
- Bottleneck inputs (industrial gases, specialty materials)
- Inspection and metrology capability
- Selective overseas assets where policy alignment matters
Marketing: more self-serve, less “spray and pray”
Expect manufacturers to shift budget away from broad awareness and toward:
- Technical content, spec hubs, and compliance packs
- Account-based programs tied to real buyer roles
- Customer portals (quoting, documentation, order tracking)
Operations: more scenario planning, more transparency
Operational strategy is moving toward:
- Logistics shock playbooks (route changes, buffer policies)
- Lead-time transparency as a competitive lever
- Automation targeted at inspection, maintenance, and high-variance processes
Trend Timeline (Last 3 Years + Projections)
Forecasted Spend per Channel/Function
| Function | Spend direction | What grows | What shrinks | Why |
|---|---|---|---|---|
| Marketing | Up slightly to up | Technical content, SEO, ABM, self-serve portals | Broad awareness, generic paid campaigns | Buyers research first; trust is built with proof and transparency |
| Sales | Flat to up (shift in mix) | Solution engineering, key account teams, distributor enablement | Low-skill outbound | Selling becomes more technical; fewer but higher-quality touches win |
| Operations | Up | Automation, AI inspection, maintenance analytics, resilience buffers | Pure cost-cutting projects | Labor constraints and quality pressure reward smart capex |
| Supply chain / logistics | Up in capability (not necessarily headcount) | Visibility tools, scenario planning, regional buffers | Single-route dependence | Disruptions make “cheap but brittle” strategies expensive later |
| Finance | More selective | Bottleneck assets, risk reduction, working-capital optimization | Non-core expansion | Cost of capital plus volatility favors resilience-first allocation |
7. Strategic Recommendations
This section is built to be usable. Not “best practices,” not vague inspiration. Real moves a manufacturing executive team can make, mapped by function, with what to do first, why it works, and how to measure impact.
The throughline across South Korea’s manufacturing landscape right now is simple: reduce fragility, raise proof, and make it easier for buyers to say yes. For manufacturing companies, that means treating reliability and transparency as competitive strategy, not just operational hygiene.
In practical terms, the highest-ROI actions tend to cluster in three places: (1) protecting continuity in manufacturing operations through bottleneck mapping and input redundancy, (2) turning technical proof into a marketing and sales accelerator by documenting the manufacturing process, and (3) investing in plant upgrades inside production facilities — especially inspection automation, industrial robotics, and artificial intelligence — where small improvements compound into better yield, OTIF, and fewer customer disputes.
Strategy Playbook Grid
| Function | Recommendation | What to do (practical first steps) | Expected impact | How to measure |
|---|---|---|---|---|
| Finance | Build a “bottleneck exposure map” and prioritize investments that protect continuity | List top inputs that can stop production (gases, materials, tools, single-source parts). Rate each by failure impact and recovery time. Mitigate via dual sourcing, buffer inventory, strategic contracts, or acquisition/partnership where needed. |
Fewer shutdowns, lower premium freight, more stable delivery performance | Line stoppage hours, premium freight spend, OTIF under disruption |
| Finance | Treat working capital like a product, not an accounting outcome | Build a weekly war-room view of inventory by risk class, receivables aging by customer, and supplier term leverage. Link to demand signals and production plans; define actions and owners. |
Frees cash without cutting strategic capex; reduces shock sensitivity | Cash conversion cycle, inventory turns, DSO/DPO, stockout rate |
| Finance | Standardize cycle-adjusted decision rules for capex | Split capex into resilience (protect), productivity (prioritize), growth (stage-gate). Require scenario cases (demand down 10–20% plus logistics shock) before approval. |
Better capex discipline, fewer regret projects | Capex ROI vs plan, utilization, payback variance |
| Marketing | Replace brochure marketing with a proof-driven technical trust system | Build spec hubs with drawings, tolerances, substitutions, certifications, and compliance packs. Add lead-time bands and explain what changes them. Ensure content answers real engineering and procurement questions. |
Higher-quality inbound, faster qualification, lower CAC | RFQ-to-quote rate, quote win rate, time-to-quote, unqualified lead share |
| Marketing | Shift 15–25% of spend from broad awareness to account-based + self-serve | Define top target accounts and personas (procurement, engineer, ops). Build role-based content paths, add self-serve RFQ tools, and align distributor/rep enablement materials. |
More pipeline from priority accounts; fewer wasted touches | Target account engagement, meetings per target account, pipeline per account |
| Marketing | Make the post-sale experience part of the brand | Deliver a post-delivery “confidence kit”: inspection summary, change-control rules, escalation contacts, FAQ, and reorder workflow. Turn support responses into reusable documentation. |
Higher retention and expansion, fewer disputes | Repeat order rate, customer complaints, expansion revenue, customer satisfaction |
| Operations | Focus automation where it improves yield and reduces labor pinch points | Prioritize inspection-heavy steps and repetitive handling tasks. Roll out machine vision/defect detection and predictive maintenance on highest downtime-cost lines first; scale with standard playbooks. |
Reduced scrap/rework, higher throughput, fewer defect escapes | Scrap rate, defect ppm, OEE, unplanned downtime, MTTR |
| Operations | Build a logistics shock playbook before the next disruption | Define trigger points (route changes, surcharge thresholds, lead-time slips). Pre-approve alternate carriers/routes and buffer rules. Create customer communication templates and escalation owners. |
Lower disruption cost and fewer missed commitments | OTIF during disruptions, premium freight spend, backlog slippage |
| Operations | Operationalize lead-time transparency as a competitive weapon | Publish lead-time bands by product family and update weekly. Align sales promises to production reality and document constraints (capacity, materials, inspection). |
Higher trust and better forecasting; fewer fire drills | Promise accuracy, expedite requests, schedule adherence |
| Cross-functional | Create a single source of truth for quoting, specs, compliance, and delivery status | Integrate ERP/MES outputs into a customer-facing portal or structured updates. Standardize documentation, reduce conflicting answers, and make it easy for buyers to self-serve. |
Faster cycles, fewer escalations, stronger customer confidence | Quote cycle time, support ticket volume, customer satisfaction, on-time delivery |
Recommendations explained (in plain language)
Finance: win by removing fragility
A lot of manufacturing margin loss isn’t because costs are too high. It’s because surprises are too expensive. Premium freight, line stoppages, expedited materials, and rework are silent killers. Finance teams that map bottlenecks and invest in stability often get better returns than teams that chase “growth capex” at the wrong point in a cycle.
Marketing: win by reducing buyer anxiety
Industrial buyers don’t want hype. They want to avoid blame. They win internally by choosing suppliers that look predictable and provable. That’s why technical proof, compliance readiness, and lead-time clarity outperform most brand campaigns. The best marketing in manufacturing makes the decision feel safe.
Operations: win by turning execution into a customer promise
Ops is now part of the go-to-market strategy. Lead-time transparency, quality consistency, and fast issue resolution are commercial differentiators. Plants that can measure, communicate, and correct quickly will win more business even if they are not the cheapest.
8. Appendices and sources
A. Raw data tables
A1) Industry snapshot metrics (from cited sources)
| Metric | Value | Year | Source |
|---|---|---|---|
| Manufacturing value added (current US$ bn) | 416.39 | 2023 | TheGlobalEconomy / World Bank |
| Manufacturing value added (% of GDP) | 24.31% | 2023 | TheGlobalEconomy / World Bank |
| Total exports (US$ bn) | 709.69 | 2025 | Wall Street Journal (Korean trade stats) |
| Semiconductor exports (US$ bn) | 173.40 | 2025 | Wall Street Journal (Korean trade stats) |
| National container throughput (TEUs) | 31.7M | 2024 | Korea.net (MOF) |
A2) Deal table (selected, disclosed)
| Buyer | Seller / Asset | Segment | Announcement date | Disclosed value | Source |
|---|---|---|---|---|---|
| Air Liquide | DIG Airgas (South Korea) from Macquarie Asset Management | Industrial gases | 2025-08 | €2.85B enterprise value | Air Liquide press release |
| Group14 Technologies | Battery active materials factory (formerly JV with SK) | Battery materials | 2025-08 | $463M Series D (acquisition value not directly comparable) | PR Newswire |
| Korea Zinc | US critical minerals processing facility (greenfield investment) | Critical minerals / materials | 2024–2025 | ~$7.4B planned investment | Financial Times |
A3) LTV:CAC benchmark ranges (by manufacturing model)
| Manufacturing business model | Typical LTV:CAC range |
|---|---|
| Commodity components | 2x–4x |
| Qualified suppliers (specialty materials, critical components) | 4x–8x |
| Engineered solutions and systems | 3x–6x |
A4) Ops KPI benchmark table
| KPI | Discrete manufacturing (electronics, components) | Process manufacturing (chemicals, materials) |
|---|---|---|
| OTIF | 85–98% | 90–99% |
| Scrap / rework | 0.5–5% | Yield loss vs spec (tracked as off-spec / yield variance) |
| Inventory turns | 4–12 | 6–20 |
| Lead-time variability | Sensitive to component shortages and inspection bottlenecks | Sensitive to energy/feedstock availability and process stability |
| Downtime impact | High on automated lines; downtime cascades into OTIF slippage | High in continuous processes; restarts are costly |
A5) Competitive matrix (summary)
| Segment | Korea positioning | Pricing posture | Key differentiator | Source |
|---|---|---|---|---|
| Memory semiconductors | Premium performance plus scale | Mid-to-premium, cycle-driven | Yield, node leadership, HBM allocation | TrendForce |
| Shipbuilding / offshore | High-spec complex vessels | Premium vs commodity yards | Execution, backlog discipline, LNG/defense capability | TradeWinds |
| Automotive | Global scale and footprint | Competitive, margin-managed | Manufacturing flexibility and localization | Hyundai Motor |
| EV batteries | High quality and OEM relationships | Under pricing pressure | Chemistry roadmap, cost curve, qualification | SNE Research |
| Petrochemicals | Scale producers in a tough cycle | Commodity-exposed | Feedstock economics and restructuring speed | Hydrocarbon Processing |
A6) Forecasted spend direction (planning lens)
| Function | Spend direction | What grows | What shrinks | Why |
|---|---|---|---|---|
| Marketing | Up slightly to up | Technical content, SEO, ABM, self-serve portals | Broad awareness, generic paid | Buyers research first; proof beats hype |
| Sales | Flat to up (mix shift) | Solution engineering, key accounts, distributor enablement | Low-skill outbound | Selling is more technical; fewer, higher-quality touches |
| Operations | Up | Automation, AI inspection, maintenance analytics, resilience buffers | Pure cost-cutting projects | Labor and quality pressure reward smart capex |
| Supply chain / logistics | Up in capability | Visibility tools, scenario planning, regional buffers | Single-route dependence | Disruptions punish brittle networks |
| Finance | More selective | Bottleneck assets, risk reduction, working-capital optimization | Non-core expansion | Cost of capital plus volatility favor resilience |
B. Hyperlinked source list (no placeholders)
Macro and industry size
Manufacturing share/value added (World Bank via TheGlobalEconomy): https://www.theglobaleconomy.com/South-Korea/Share_of_manufacturing/
Exports record (2025): https://www.wsj.com/economy/trade/south-koreas-exports-stronger-than-expected-in-december-set-annual-record-in-2025-5f3f69dd
Ports throughput record (2024): https://www.korea.net/Government/Briefing-Room/Press-Releases/view?articleId=7812&type=O
Manufacturing PMI (S&P Global landing): https://www.pmi.spglobal.com
Red Sea logistics disruption context: https://www.dhl.com/kr-en/home/global-forwarding/latest-news-and-webinars/red-sea-situation-impact-shipping.html
Robot density (IFR): https://ifr.org/ifr-press-releases/news/global-robot-density-in-factories-doubled-in-seven-years
Finance and deals
Air Liquide–DIG Airgas: https://www.airliquide.com/group/press-releases-news/2025-08-22/air-liquide-announces-signature-agreement-acquire-dig-airgas-leading-integrated-gas-player-south
Group14 funding + factory ownership: https://www.prnewswire.com/news-releases/group14-closes-us463m-series-d-funding-round-and-acquires-100-ownership-of-bam-factory-in-south-korea-from-sk-inc-302533912.html
Korea Zinc critical minerals investment: https://www.ft.com/content/d885ab55-b4f8-4c8f-a213-94f2778863ac
Marketing and buyer behavior
McKinsey B2B buying shifts: https://www.mckinsey.com/capabilities/growth-marketing-and-sales/our-insights/five-fundamental-truths-how-b2b-winners-keep-growing
Gartner press release on rep-free preference: https://www.gartner.com/en/newsroom/press-releases/2025-06-25-gartner-sales-survey-finds-61-percent-of-b2b-buyers-prefer-a-rep-free-buying-experience
Competitive / segment sources
DRAM ranking context (TrendForce): https://www.trendforce.com/presscenter/news/20240815-12254.html
Shipbuilding recovery context: https://www.tradewindsnews.com/finance/shipbuilder-hanwha-ocean-sees-profit-surge-as-lng-and-defence-underpin-recovery/2-1-1938458
Shipbuilding share context: https://maritime-executive.com/article/korea-claws-back-market-share-as-global-shipbuilding-market-cools
Hyundai sales/targets: https://www.hyundai.com/worldwide/en/newsroom/detail/hyundai-motor-reports-2024-global-sales-and-2025-targets-0000000890
EV battery share (SNE Research): https://www.sneresearch.com/en/insight/release_view/371/page/0
Petrochem restructuring context: https://www.hydrocarbonprocessing.com/news/2025/08/major-south-korean-petrochemical-firms-and-production/
Operations and smart factory programs
Korea SME smart factory program (MSS): https://www.mss.go.kr/site/eng/ex/bbs/View.do?bcIdx=1056938&cbIdx=244
C. Notes on data limitations (important for client trust)
- “Top 10 M&A deals” completeness: without a paid deal database (LSEG/Refinitiv, Bloomberg, PitchBook), any “top 10” list risks missing private or undisclosed transactions. The deal table here includes only high-confidence, link-verifiable items.
- Multiples and unit economics: EV/Revenue, EV/EBITDA, and LTV:CAC are highly segment- and cycle-dependent in manufacturing. The ranges used are benchmarking heuristics and should be validated against the specific peer set and time window you’re analyzing.
- KPI ranges: ops KPI benchmarks vary sharply by product complexity, customer mix (OEM vs aftermarket), and demand volatility. Use these as a starting point for benchmarking, then tighten with internal plant data or a targeted peer survey.
Disclaimer: The information on this page is provided by Manufacturing.co for general informational purposes only and does not constitute financial, investment, legal, tax, or professional advice, nor an offer or recommendation to buy or sell any security, instrument, or investment strategy. All content, including statistics, commentary, forecasts, and analyses, is generic in nature, may not be accurate, complete, or current, and should not be relied upon without consulting your own financial, legal, and tax advisers. Investing in financial services, fintech ventures, or related instruments involves significant risks—including market, liquidity, regulatory, business, and technology risks—and may result in the loss of principal. Manufacturing.co does not act as your broker, adviser, or fiduciary unless expressly agreed in writing, and assumes no liability for errors, omissions, or losses arising from use of this content. Any forward-looking statements are inherently uncertain and actual outcomes may differ materially. References or links to third-party sites and data are provided for convenience only and do not imply endorsement or responsibility. Access to this information may be restricted or prohibited in certain jurisdictions, and Manufacturing.co may modify or remove content at any time without notice.