
The State of Japanese Manufacturing Market Research Report
1. Industry Overview and Executive Summary
Japan’s manufacturing sector is no longer about volume dominance. It’s about precision, resilience, and strategic relevance. The country still sits at the center of global supply chains for autos, advanced machinery, electronics components, materials, and increasingly semiconductors, but the playbook has changed. Cost leadership has given way to automation intensity, supply assurance, and policy-backed industrial security.
This matters because Japanese manufacturing now behaves less like a cyclical export machine and more like national infrastructure. That shift shows up in capital allocation, M&A behavior, marketing strategy, and plant operations.
Market size, momentum, and macro outlook
Japan remains one of the world’s largest manufacturing economies, contributing roughly 20 percent of domestic GDP and anchoring global production networks in automotive, machinery, and high-value components. While long-term growth is modest compared to emerging markets, near-term momentum improved into early 2026.
Factory sentiment turned positive at the start of the year. Japan’s Manufacturing PMI moved from contraction in November 2025 (48.7) to expansion territory by January 2026 (51.5), crossing the critical 50 threshold that signals improving operating conditions. This reversal reflects stabilizing export demand, inventory normalization, and renewed production scheduling rather than a sudden demand boom.
Source: Trading Economics (S&P Global PMI)
https://tradingeconomics.com/japan/manufacturing-pmi
Actual output data tells a similar, more cautious story. The Ministry of Economy, Trade and Industry reported industrial production essentially flat in December 2025, down 0.1 percent month over month. However, METI’s forward-looking manufacturer survey pointed to a sharp production increase in January 2026, followed by a pullback in February. This pattern is common in Japanese manufacturing and usually reflects model transitions, planned shutdowns, and inventory adjustments rather than structural weakness.
Source: METI – Indices of Industrial Production
https://www.meti.go.jp/english/statistics/tyo/iip/index.html
The macro backdrop is mixed but manageable:
- Yen weakness continues to support exporters while raising import costs for energy and raw materials.
- Input price pressure remains elevated, especially for metals, energy, and logistics.
- Domestic demand is stable but not accelerating, reinforcing export dependence.
Key drivers of industry growth
Automation as a labor substitute, not a productivity bonus
Japan’s shrinking workforce is no longer a future risk, it’s an operating reality. Manufacturing growth is increasingly tied to how effectively firms replace labor hours with automation. Japan already leads the world in industrial robot deployment, particularly in automotive manufacturing, where robot density reached roughly 1,531 units per 10,000 employees in 2023. For context, the global average across industries is about 162.
Source: International Federation of Robotics, reported by The Robot Report
https://www.therobotreport.com/japanese-automotive-industry-hits-five-year-high-automation/
Economic security and semiconductor policy
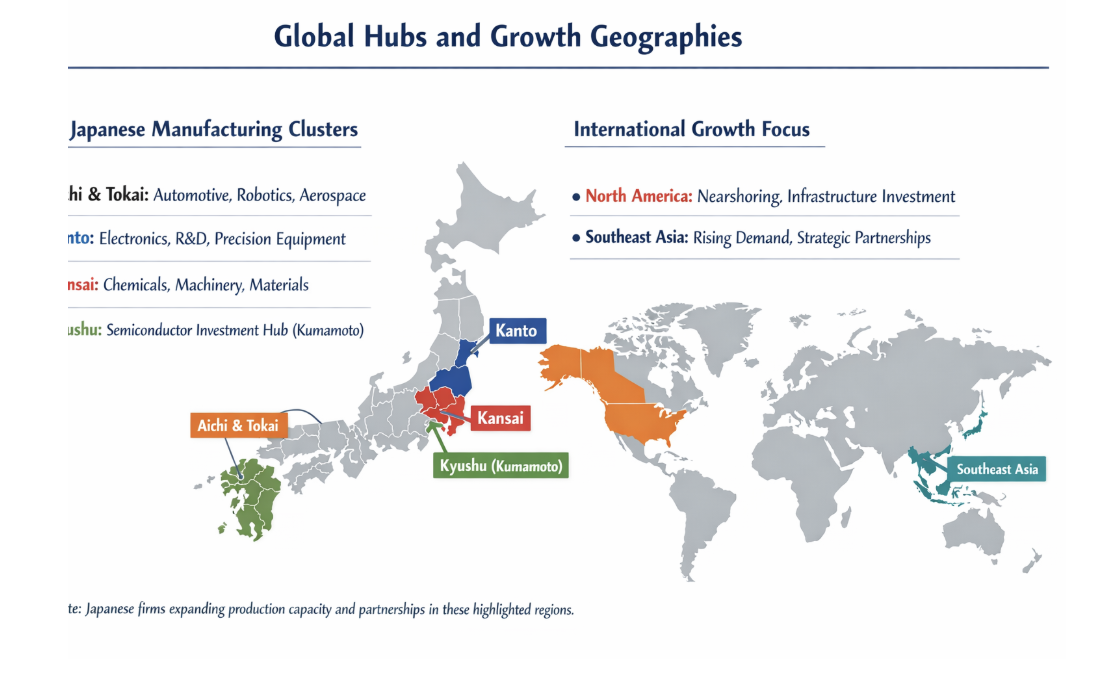
Manufacturing growth is being actively shaped by government policy. Japan’s semiconductor strategy explicitly frames chip production, materials, and equipment as national security priorities. This has unlocked large-scale subsidies, R&D support, and infrastructure investment, most visibly in Kyushu, where advanced semiconductor fabrication is returning after decades of decline.
Source: METI – Semiconductor and Digital Industry Strategy
https://www.meti.go.jp/english/policy/0704_001.pdf
Supply chain redesign, not just reshoring
Rather than full reshoring, Japanese manufacturers are building redundancy: dual sourcing, regionalized production, and tighter supplier integration. This approach reflects lessons from COVID-era disruptions and ongoing geopolitical uncertainty.
Logistics constraints as a forcing function
Japan’s logistics sector faces structural limits due to driver working-hour regulations introduced in 2024. These constraints reduce effective transport capacity unless manufacturers redesign shipment frequency, pallet density, and warehouse automation. As a result, logistics efficiency has become a growth lever, not a back-office issue.
Source: Mitsui Global Strategic Studies Institute
https://www.mitsui.com/mgssi/en/report/detail/__icsFiles/afieldfile/2023/06/16/2305i_takashima_e.pdf
Cross-functional executive summary
From a finance perspective
Capital is flowing toward assets that increase resilience: automation, semiconductors, energy efficiency, and digital control of factories. Corporate restructuring and governance reform have unlocked significant M&A activity, with manufacturers simplifying group structures, selling non-core assets, and taking strategic subsidiaries private to regain operational flexibility. Financial performance is increasingly judged on cash generation, backlog quality, and capital efficiency rather than headline growth.
From a marketing perspective
Manufacturing buyers are changing how they buy. Global B2B research shows a strong shift toward self-directed purchasing, with buyers preferring to complete research digitally before engaging sales. In Japan, this trend intersects with traditionally long decision cycles and consensus-based procurement. The result: suppliers that provide clear technical proof, compliance readiness, and transparent lead times win mindshare earlier in the buying process.
Source: Gartner B2B Buyer Survey
https://www.gartner.com/en/newsroom/press-releases/2025-06-25-gartner-sales-survey-finds-61-percent-of-b2b-buyers-prefer-a-rep-free-buying-experience
From an operations perspective
Operations teams are under pressure from all sides: labor shortages, logistics constraints, cybersecurity risks, and energy costs. The companies pulling ahead are those treating operations as systems to be redesigned, not departments to be optimized. This includes deeper automation, tighter production planning, and integration between IT and OT environments.
Industry Snapshot Table
| Dimension | What to watch | Latest signal (selected) | Why it matters |
|---|---|---|---|
| Demand | PMI direction, export orders | PMI moved from contraction to expansion: 48.7 (Nov 2025) → 50.0 (Dec 2025) → 51.5 (Jan 2026). Source: https://tradingeconomics.com/japan/manufacturing-pmi |
Early read on operating momentum before it shows up in earnings or capex. |
| Output | Industrial Production (IIP), shipment and inventory swings | METI reports Dec 2025 production index (SA) at 101.8 and -0.1% m/m; forward survey signals a Jan 2026 rise then Feb 2026 pullback. Source: https://www.meti.go.jp/english/statistics/tyo/iip/index.html |
Separates sentiment from real throughput and helps spot inventory resets vs structural demand. |
| Automation | Robot density, automation capex, skill mix shift | Japan automotive robot density: 1,531 robots per 10,000 employees (2023); global average about 162. Source: https://www.therobotreport.com/japanese-automotive-industry-hits-five-year-high-automation/ |
Signals the sector’s response to labor scarcity: maintain output by redesigning work around automation. |
| Strategic investment | Semiconductor policy, subsidies, ecosystem buildout | METI frames semiconductor production and related industries as economic security priorities, supported by multi-year programs. Source: https://www.meti.go.jp/english/policy/0704_001.pdf |
Industrial policy shapes site selection, capital flows, and supplier opportunity maps. |
| Logistics | Transport capacity, delivery reliability, warehouse automation | Driver working-hour constraints (“2024 problem”) reduce effective logistics capacity unless networks and loads are redesigned. Source: https://www.mitsui.com/mgssi/en/report/detail/__icsFiles/afieldfile/2023/06/16/2305i_takashima_e.pdf |
Turns logistics into a growth lever: shipment design, 3PL choices, and facility layout affect service levels. |
Global Hubs and Growth Geographies
2. Finance and Investment Landscape
Japanese manufacturing finance in 2026 feels like a three-lane highway.
Lane 1 is governance-driven restructuring: take-privates, parent-subsidiary cleanups, and portfolio simplification. Lane 2 is capability buying: automation, OT cybersecurity, and factory intelligence. Lane 3 is policy-shaped capital: semiconductors and strategic supply chains getting direct support.
If you’re trying to understand where the sector is headed, don’t start with buzzwords. Start with where cash is being committed, what kinds of assets are being bought, and what that says about how manufacturers plan to compete.
Recent M&A activity
What’s actually happening
Japan’s broader M&A market has been running hot, with reported record-high deal counts in 1H 2025 and a narrative centered on corporates restructuring after years of governance reform pressure. (ION Analytics, Chambers Practice Guides)
In manufacturing specifically, the pattern is consistent:
- Simplify and consolidate group structures (free up capital, reduce cross-shareholdings, improve governance optics)
- Acquire automation and “factory control plane” assets (robots, industrial software, OT security)
- Rebalance portfolios away from commodity exposure toward specialty, higher-margin segments (chemicals are a clean example of this pivot) (Chemical & Engineering News)
Deal Table
| Date (announced/closed) | Buyer | Seller / Target | Amount (reported) | Strategic theme | Source |
|---|---|---|---|---|---|
| Feb 2026 (tender deadline referenced) | Toyota-led consortium | Toyota Industries (take-private) | ¥5.4T offer (reported) | Governance + group simplification | https://www.ft.com/content/d1b579e2-660a-4806-82c5-dde9c03a85df |
| Oct 2025 (announced) | SoftBank Group | ABB Robotics | $5.375B (reported) | Automation platform + “physical AI” bet | https://group.softbank/en/news/press/20251008 |
| Sep 2025 (announced; Q4 close expected) | Mitsubishi Electric | Nozomi Networks (OT/ICS security) | $1.0B (incl. $883M cash) | OT cybersecurity as core manufacturing capability | https://www.wsj.com/articles/mitsubishi-electric-to-buy-nozomi-networks-in-1-billion-deal-67c5560f |
| Jun 18, 2025 (closed) | Nippon Steel | U.S. Steel | ~$14B+ (widely reported) | Scale + market access in heavy industry | https://www.washingtonpost.com/business/2025/06/18/steel-nippon-golden-share-trump/ |
| Apr 1, 2025 (closed) | UBE Corporation | LANXESS Urethane Systems business | Not disclosed | Portfolio reshaping (specialty materials) | https://lanxess.com/en/media/press-releases/2025/04/lanxess-completes-sale-of-its-urethane-systems-business-to-ube-corporation |
Dealmaking themes you should take seriously
- Take-privates are now a mainstream tool, and they are getting contested.
Toyota’s Toyota Industries process shows how activists and price discovery can shape even “old Japan” style group transactions. (Financial Times, Financial Times) - Factory cyber is consolidating.
The Nozomi deal is the clearest signal: manufacturers are buying defensive moats around operational continuity. If a plant can’t run, nothing else matters. (Wall Street Journal, nozominetworks.com) - Automation is being priced like a long-duration secular bet.
ABB’s disclosure that its robotics unit had 2024 revenue of $2.3B and an Operational EBITA margin of 12.1% helps explain why buyers treat this as a platform, not a product line. (ABB Group, SoftBank Group)
Investment trends: PE/VC, strategic capital, and dry powder behavior
Private equity: still unusually resilient in Japan
Bain reports that Japan exceeded JPY 3 trillion in PE deal value for the fourth consecutive year, with 2024 at JPY 3.1T, and describes 2025 as a strong start. (Bain)
PitchBook data (as summarized in its coverage) points to $29.4B in PE deals in the first three quarters of 2025 and notes Japan’s deal activity has resisted the broader Asia slowdown. (PitchBook)
What that means for manufacturing
- More carve-outs and divestitures: PE is a natural buyer for non-core industrial assets that large corporates want off the books.
- More operational upgrading: PE playbooks in Japan increasingly include ERP modernization, procurement optimization, plant productivity, and governance cleanup.
Strategic and policy-shaped capital: semiconductors lead
METI’s semiconductor strategy outlines very large programmatic support, including a post-5G R&D fund (645.6 billion yen) and an example subsidy for the TSMC/Sony/Denso JV (up to 476 billion yen). (meti.go.jp)
Net-net: the sector isn’t just “investing in chips.” It’s underwriting an ecosystem (materials, equipment, talent, and supply resilience).
Revenue models and unit economics (how money really gets made)
If you only look at product margin, you miss the most important lever in industrial manufacturing: lifecycle economics.
The modern profit engine is often:
- Equipment sale (lower margin, competitive)
- Installed base expansion (volume, footprint)
- Aftermarket parts + service (higher margin, recurring)
- Upgrades (software, controls, retrofits, energy optimization)
- Performance-based contracts (uptime, yield, throughput guarantees)
Two useful anchor points from reputable research:
- McKinsey highlights how budget constraints can push customers to prioritize aftermarket and service over new unit purchases, increasing the strategic importance of services. (McKinsey & Company)
- BCG’s services benchmark work reports that companies prioritizing aftermarket services generate one-third or more of total income from services, and that services growth has been outpacing new equipment sales. (BCG Global)
Practical unit economics translation
For many Japanese manufacturers, “LTV” is not a subscription metric. It’s the gross profit from the installed base over 10–20 years, weighted by:
- Service attach rate
- Parts capture rate (how much of the parts spend you actually win)
- Upgrade cadence
- Downtime sensitivity (which influences willingness to pay for reliability)
CAC is also different here
Most CAC is people and process cost:
- Sales engineers
- Qualification testing
- Supplier audits
- Compliance documentation
- Long-cycle procurement
So instead of obsessing over a single LTV:CAC ratio, the sharper manufacturing lens is:
- Payback period on acquisition and onboarding cost
- ontribution margin over the contract lifecycle
- Expansion rate inside the account (plants, lines, regions)
Directional benchmark note
Generic LTV:CAC benchmarks exist (often compiled from marketing datasets), but they vary heavily by industry and methodology, so treat them as directional context only, not ground truth for Japanese manufacturing. (First Page Sage, First Page Sage)
LTV:CAC Ratio Chart
| Industry Category | LTV:CAC (x) | Chart (ASCII bar) | Source |
|---|---|---|---|
| Manufacturing (general) | 3.0× | ██████ | https://firstpagesage.com/seo-blog/the-ltv-to-cac-ratio-benchmark/ |
| Automotive | 3.0× | ██████ | https://firstpagesage.com/seo-blog/the-ltv-to-cac-ratio-benchmark/ |
| Industrial IoT | 4.0× | ████████ | https://firstpagesage.com/seo-blog/the-ltv-to-cac-ratio-benchmark/ |
| Aerospace & Defense | 4.5× | █████████ | https://firstpagesage.com/seo-blog/the-ltv-to-cac-ratio-benchmark/ |
| PCB Design & Manufacturing | 4.5× | █████████ | https://firstpagesage.com/seo-blog/the-ltv-to-cac-ratio-benchmark/ |
Financial health indicators that matter in Japanese manufacturing
If you’re evaluating firms operationally (not as investment advice), these indicators tend to predict durability:
Cash and working capital
- Inventory days and WIP aging (high-mix factories can hide problems here)
- Supplier terms vs customer terms (who is financing whom)
- Cash conversion cycle trend
Demand quality
- Backlog aging (how much is real vs “soft”)
- Cancellation rates and pushouts
- Customer concentration (single-OEM risk is real)
Operational leverage
- Percent of costs that are variable vs fixed (this dictates resilience in downturns)
- Capex efficiency (automation ROI measured in throughput/yield, not vague “DX”)
- Service attach rate and recurring revenue mix (BCG Global, McKinsey & Company)
Risk and resilience
- Cyber resilience in OT environments (a plant stoppage is a financial event)
- Regulatory exposure (competition reviews can slow or derail strategic moves) (Competition.Today, Wall Street Journal)
EV/Revenue + EV/EBITDA Multiples
| Industry Segment | EV / Revenue (x) | EV / EBITDA (x) | Source |
|---|---|---|---|
| Automotive & Trucks | 3.88× | — | https://pages.stern.nyu.edu/~adamodar/New_Home_Page/datafile/psdata.html |
| Auto Parts | 0.82× | 6.43× | https://pages.stern.nyu.edu/~adamodar/New_Home_Page/datafile/psdata.html
https://pages.stern.nyu.edu/~adamodar/New_Home_Page/datafile/vebitda.html |
| Specialty Chemicals | 2.65× | 13.36× | https://pages.stern.nyu.edu/~adamodar/New_Home_Page/datafile/psdata.html
https://pages.stern.nyu.edu/~adamodar/New_Home_Page/datafile/vebitda.html |
| Electronics (General) | 3.21× | 19.99× | https://pages.stern.nyu.edu/~adamodar/New_Home_Page/datafile/psdata.html
https://pages.stern.nyu.edu/~adamodar/New_Home_Page/datafile/vebitda.html |
| Electrical Equipment | 4.42× | 24.59× | https://pages.stern.nyu.edu/~adamodar/New_Home_Page/datafile/psdata.html
https://pages.stern.nyu.edu/~adamodar/New_Home_Page/datafile/vebitda.html |
| Aerospace & Defense | — | 21.58× | https://pages.stern.nyu.edu/~adamodar/New_Home_Page/datafile/vebitda.html |
for that segment in the referenced table.
3. Marketing Performance and Trends
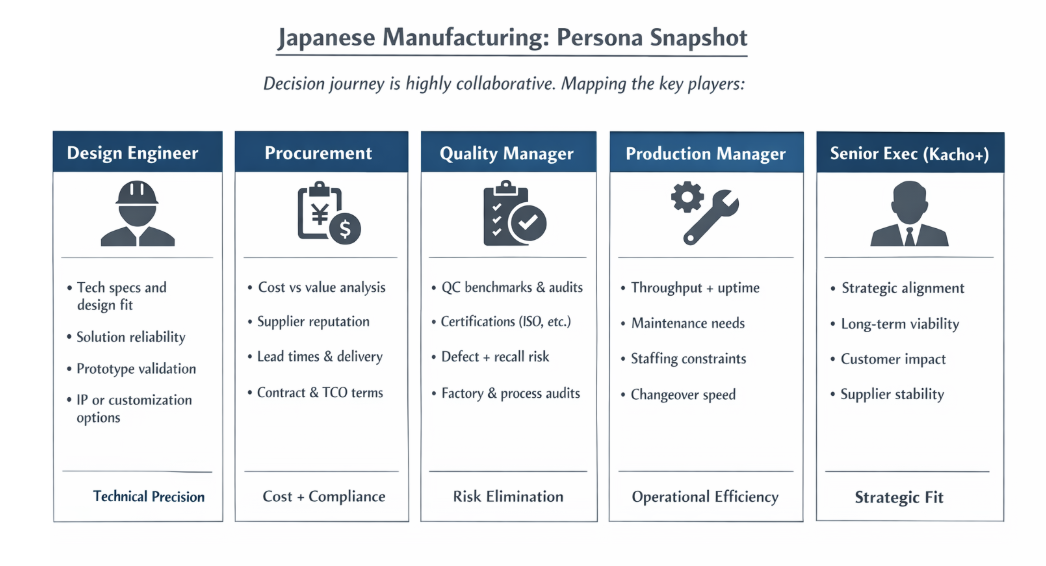
Marketing in Japanese manufacturing doesn’t behave like marketing in SaaS or consumer goods. There’s no quick funnel, no impulse buy, and no single “decision-maker.” What works here is credibility, patience, and relevance. The goal isn’t to persuade fast. It’s to earn a seat in a long decision process and not get disqualified early.
The past few years have reshaped how that happens. Buyers now do more research on their own, expect clearer digital proof, and are far less tolerant of generic outreach. At the same time, traditional expectations around trust, references, and risk avoidance in Japan haven’t gone away. They’ve stacked on top of each other.
Channel breakdown and performance logic
In manufacturing, channel ROI is less about clicks and more about influence. A channel “works” if it:
- Gets shortlisted instead of filtered out
- Supports internal consensus at the buyer
- Reduces perceived technical, operational, or compliance risk
Here’s how the major channels tend to perform in practice.
SEO and technical content
This is still the highest-leverage channel for complex manufacturing buyers. Engineers, procurement teams, and quality managers actively search for specs, tolerances, certifications, materials data, and lead-time information.
What performs:
- Detailed spec pages (not PDFs buried three clicks deep)
- CAD models, drawings, and configuration tools
- Application notes showing real operating conditions
- Clear documentation of standards (ISO, IATF, RoHS, REACH, cybersecurity posture)
Why it matters: buyers increasingly want to self-qualify suppliers before talking to sales. If your technical content is thin, you never make the longlist.
Paid search
Paid search works, but only for narrow, high-intent queries: part numbers, product families, urgent replacement needs. Broad awareness campaigns tend to underperform.
Best use cases:
- Capturing late-stage demand
- Defending branded terms
- Supporting product launches with clear differentiation
Risk: CPCs can spike quickly in niche industrial categories, and traffic quality drops fast if keywords aren’t tightly controlled.
LinkedIn and industry media
These channels are more about positioning than conversion. They’re useful when you’re:
- Entering a new category
- Repositioning from commodity to solution provider
- Targeting specific roles at large accounts
The mistake many manufacturers make is treating these channels like lead-gen engines. In reality, their value shows up later as brand familiarity during RFQs and audits.
Email and account-based nurturing
Email still matters, but only when it’s targeted and useful. Generic newsletters are mostly ignored.
What works:
- Application-specific updates
- Regulatory or standards changes that affect the buyer
- Case studies relevant to the recipient’s industry or process
In Japan especially, email often supports internal sharing. Content that’s easy to forward internally helps move consensus along.
Events and trade shows
Trade shows remain disproportionately important in Japanese manufacturing. They’re still one of the fastest ways to:
- Build trust
- Demonstrate physical quality
- Get real engineering questions
The real ROI isn’t booth traffic. It’s what happens after: follow-up meetings, samples, audits, and pilot programs. Companies that don’t resource post-event follow-up leave most of the value on the floor.
Multi-Channel Performance Table
| Channel | Typical role | Strength | Common failure mode |
|---|---|---|---|
| SEO / technical content | Early-stage qualification | High intent, long shelf life | Too shallow or outdated |
| Paid search | Capture urgent demand | Fast, measurable | Overbroad keywords |
| LinkedIn / media | Positioning | Role-based reach | Expecting direct conversion |
| Consensus support | Low cost, scalable | Generic messaging | |
| Trade shows | Trust building | High signal interactions | Weak follow-up |
Buyer behavior trends shaping strategy
Self-directed buying is now the norm
Global B2B research shows a clear preference for rep-free or low-touch buying during early stages. A Gartner survey found that 61 percent of B2B buyers prefer to complete research without a sales rep, and 73 percent actively avoid suppliers that push irrelevant outreach.
For manufacturing marketers, this changes the job:
- Content replaces early sales conversations
- Clarity beats persuasion
- Relevance beats frequency
Buyers still want sales, just later
This doesn’t mean sales teams are obsolete. It means they enter the process later, when the buyer is already informed and evaluating risk. Marketing’s job is to make sure the first live conversation doesn’t start from zero.
Japan-specific dynamics still matter
Despite digital shifts, Japanese manufacturing buyers remain:
- Consensus-driven
- Risk-averse
- Heavily influenced by references and track record
A supplier with weaker digital presence but strong domestic references can still win. The best performers combine both: strong digital proof plus local credibility.
Decision triggers that actually move deals
- Supply risk reduction (dual sourcing, capacity guarantees)
- Compliance confidence (audits, traceability, cybersecurity)
- Lifecycle cost clarity (energy use, maintenance, uptime)
- Responsiveness during disruptions (shortages, recalls, model changes)
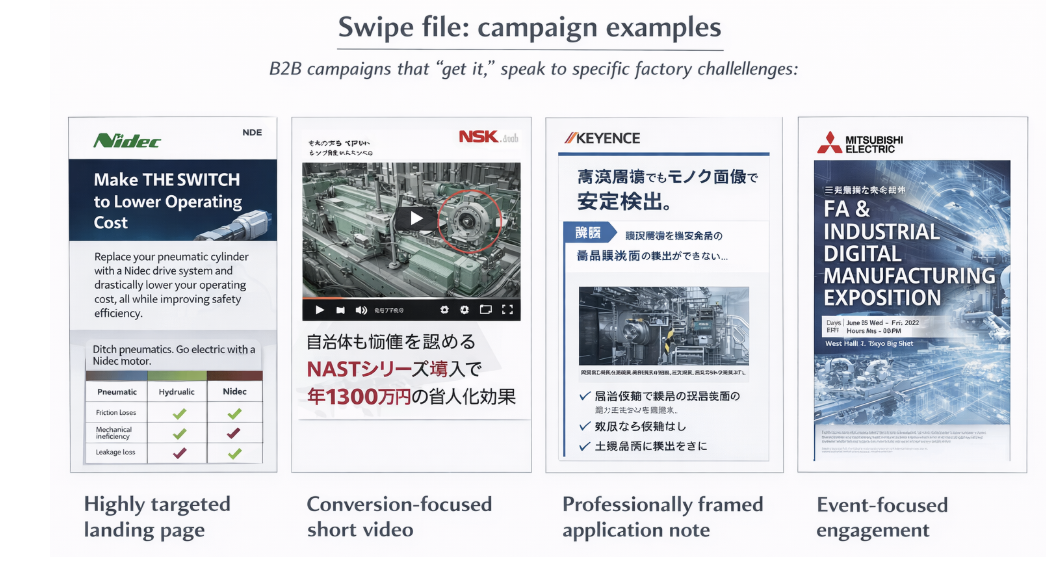
Creative and messaging that performs best
The fastest way to lose a manufacturing buyer is vague messaging. Claims without numbers or context get ignored.
High-performing themes
- “Here’s the exact problem we solved”
- “Here’s the measurable result”
- “Here’s how long it took”
- “Here’s what went wrong and what we changed”
Numbers beat adjectives every time.
Messaging angles that consistently resonate
- yield improvement (before/after)
- defect reduction (ppm, scrap rate)
- lead-time stability under disruption
- energy or cost savings over the lifecycle
- uptime guarantees and service response times
Tone matters
Overly polished marketing language can backfire. Engineers and plant managers respond better to straightforward, slightly conservative communication that feels grounded in reality.
Market positioning and brand perception
Positioning in Japanese manufacturing is often implicit, not explicit. Buyers infer who you are based on:
- Who already uses you
- How you respond to issues
- How transparent you are about limitations
Common positioning archetypes
- “Safe supplier”: trusted, conservative, predictable
- “Problem solver”: called when something breaks or constraints tighten
- “Innovation partner”: involved early in design and process decisions
Most companies want to be all three. Very few actually are. The strongest brands pick one primary role and support it consistently.
Brand perception is built operationally
In this sector, marketing can’t outrun operations. Missed deliveries, unclear specs, or slow responses undo years of brand-building. Conversely, strong operational performance quietly compounds reputation over time.
Persona Snapshot
Swipe File: Campaign Examples
4. Operational Benchmarking
Operations are where Japanese manufacturing either compounds its advantages or quietly bleeds competitiveness. Labor shortages, logistics constraints, cybersecurity risk, and energy costs have turned operations into a board-level topic. The companies outperforming peers aren’t doing anything flashy. They’re redesigning systems end to end and measuring what actually moves throughput, reliability, and cost.
Supply chain and logistics
The constraint environment is structural, not cyclical
Japan’s logistics system is under sustained pressure from the so-called “2024 problem”: legally enforced limits on truck driver working hours. This effectively reduces available transport capacity even if demand stays flat. The impact isn’t theoretical. Manufacturers now face:
- Fewer daily delivery slots
- Higher spot logistics costs
- Increased risk of missed shipments during peaks
Source: Mitsui Global Strategic Studies Institute
https://www.mitsui.com/mgssi/en/report/detail/__icsFiles/afieldfile/2023/06/16/2305i_takashima_e.pdf
What top operators are doing differently
Rather than chasing cheaper freight, leading manufacturers are redesigning how freight is used:
- Increasing pallet density and standardized packaging
- Shifting from daily to consolidated shipment schedules
- Using cross-docking to reduce dwell time
- Co-locating inventory closer to customers or final assembly sites
Warehousing is also changing. Automation in distribution centers is no longer about labor savings alone; it’s about maintaining service levels under constrained headcount.
Ports and international flows still matter
Japan’s export performance remains sensitive to port throughput and global congestion. Public port statistics (for example, Yokohama) show how closely cargo volumes track industrial activity. Global congestion events still force manufacturers to carry more buffer inventory and quote longer lead times.
Source: City of Yokohama Port Statistics
https://www.city.yokohama.lg.jp/lang/overseas/port/tokei/statistics.files/01-e.pdf
Workforce structure and hiring benchmarks
Labor scarcity is the defining operational reality
Japan’s manufacturing workforce is shrinking and aging. The challenge isn’t just headcount; it’s skills. Plants increasingly struggle to hire:
- Experienced maintenance technicians
- Controls and automation engineers
- OT-capable IT and cybersecurity staff
This shifts workforce strategy from “hire more” to “design jobs differently.”
Common workforce patterns in high-performing plants
- Smaller core teams with broader skill coverage
- Heavier reliance on automation technicians rather than line operators
- Selective outsourcing of non-core maintenance or logistics tasks
- Structured knowledge capture to reduce dependence on senior workers nearing retirement
Team structure benchmarks (directional, varies by plant)
- production staff per line trending down as automation increases
- maintenance staff per asset trending up in skill level, not headcount
- higher training spend per employee, focused on multi-skill certification
Regulatory considerations
Operational leaders also need to track evolving labor-related requirements, including disability employment quotas and workplace accommodation standards. These affect plant design, job definitions, and compliance risk if handled reactively rather than by design.
Source: Financial Times coverage of Japan labor policy
https://www.ft.com/content/ab0763d9-bc3c-4a31-ad84-b400b2f936c1
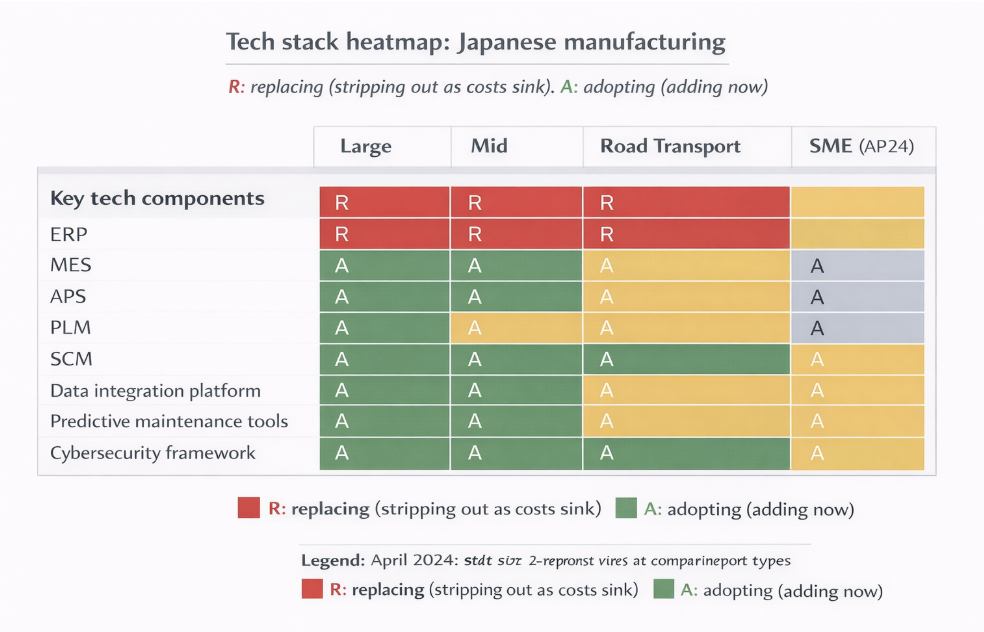
Technology stack benchmarks
ERP and core systems
Large and mid-sized Japanese manufacturers continue migrating away from heavily customized legacy ERPs toward standardized, cloud-enabled cores. The goal isn’t just IT efficiency; it’s faster integration after acquisitions and clearer operational visibility.
Source: Fujitsu ERP transformation announcements
https://global.fujitsu/en-global/pr/news/2025/10/17-01
Manufacturing execution and planning
Modern operations increasingly rely on tighter integration between:
- ERP (orders, finance, procurement)
- MES (production execution, traceability)
- APS (advanced planning and scheduling)
This integration matters most in high-mix, low-volume environments where manual scheduling breaks quickly.
Data, analytics, and AI
The most common high-ROI use cases aren’t futuristic:
- Predictive maintenance
- Quality anomaly detection
- Yield optimization
- Energy monitoring
AI adoption is pragmatic. If it doesn’t reduce downtime or scrap, it doesn’t survive budget review.
OT cybersecurity as table stakes
Operational technology security has moved from “nice to have” to “license to operate.” Ransomware or control system compromise is now treated as a production-stopping risk.
The growing adoption of IEC 62443 as a reference framework reflects this shift, especially for manufacturers supplying global OEMs.
Sources:
PwC Japan on IEC 62443
https://www.pwc.com/jp/ja/knowledge/column/awareness-cyber-security/digitizing-factory-cyber-security-iec62443.html
Mitsubishi Electric–Nozomi Networks acquisition context
https://www.wsj.com/articles/mitsubishi-electric-to-buy-nozomi-networks-in-1-billion-deal-67c5560f
Fulfillment and customer service strategies
Fulfillment expectations are rising
Customers increasingly expect:
- Shorter, more reliable lead times
- Real-time order status visibility
- Faster response to changes or disruptions
This pushes manufacturers to integrate production planning with customer-facing systems, not run them in isolation.
Customer service as an operational function
In manufacturing, customer service is often embedded in operations:
- Engineering support
- Quality response teams
- Field service and maintenance
High-performing companies treat service as a revenue and retention lever, not a cost center. Faster response times and clearer escalation paths directly influence renewal, expansion, and referenceability.
Core operational KPIs used by top performers
While benchmarks vary by subsector, the metrics that consistently correlate with resilience include:
Production and quality
- OEE by line or cell
- First-pass yield
- Defect rate (ppm)
- Schedule adherence (plan vs actual)
Supply chain
- Supplier OTIF (on-time, in-full)
- Inventory turns
- WIP aging
Maintenance and reliability
- Mean time between failure (MTBF)
- Mean time to repair (MTTR)
- Percent of maintenance that is planned vs reactive
Service and fulfillment
- Order lead time variability
- Response time to quality or service issues
- Service attach rate on installed base
Tech Stack Heatmap
Ops KPI Table
| KPI Category | Metric | What it measures | Why it matters |
|---|---|---|---|
| Production efficiency | OEE (Overall Equipment Effectiveness) | Availability × performance × quality per line or cell | Strong proxy for whether automation, staffing, and maintenance are actually working. |
| Production quality | First-pass yield | Percent of units produced without rework | Direct indicator of process stability and engineering quality. |
| Production quality | Defect rate (PPM) | Defects per million units | Critical for OEM trust, recall risk, and long-term supplier status. |
| Planning discipline | Schedule adherence | Planned vs actual production output | Reveals planning accuracy and how well constraints are being managed. |
| Supply chain | Supplier OTIF | On-time, in-full delivery from suppliers | Predicts downstream disruptions before they hit customers. |
| Inventory | Inventory turns | Annual cost of goods sold ÷ average inventory | Shows capital efficiency and exposure to obsolescence. |
| Inventory | WIP aging | Time inventory spends in production | High values often hide bottlenecks, rework loops, or quality instability. |
| Reliability | MTBF (Mean Time Between Failure) | Average operating time between failures | Core indicator of asset health and maintenance effectiveness. |
| Reliability | MTTR (Mean Time to Repair) | Average time to restore equipment | Determines how costly failures really are and drives uptime recovery. |
| Maintenance strategy | Planned maintenance ratio | Percent of maintenance that is planned vs reactive | Higher ratios correlate strongly with uptime, safety, and lower cost. |
| Fulfillment | Lead time variability | Variance in order-to-delivery time | Customers value predictability; volatility drives expediting and churn risk. |
| Customer service | Response time to issues | Time to first action on quality/service issues | Predicts retention, expansion, and referenceability. |
| Service economics | Service attach rate | Percent of installed base under service contract | Drives recurring revenue and installed-base lifetime value. |
| Risk & resilience | OT/cyber incident count | Production-impacting cyber or control incidents | A single incident can cause downtime, safety issues, and material financial loss. |
5. Competitor and Market Landscape
Japanese manufacturing isn’t one market. It’s a stack of overlapping arenas: autos, precision machinery, electronics components, factory automation, materials, and now semiconductors. The competitive picture only makes sense if you look at who controls which layer of the stack.
A useful framing: Japan wins less on “cheap production” and more on “high-stakes reliability.” That shows up in long customer relationships, heavy engineering involvement, and unusually strong positions in specific component categories. JETRO notes Japan holds over 60% global share in 220 product categories (particularly electronics and automotive components), which is a reminder that dominance often lives in the unglamorous middle of the supply chain. (JETRO)
Top players and how they compete
Instead of forcing a single market-share ranking (it’s not apples-to-apples across subsectors), here’s the practical view: the companies that shape the sector because they set standards, influence supply chains, or control critical enabling tech.
Core “gravity” players (illustrative, cross-subsector)
- Toyota and its ecosystem (auto + supplier network + manufacturing methods)
Why they matter: Toyota still sets operational expectations globally (quality, takt time discipline, supplier development). Its ecosystem effects ripple into tooling, robotics, materials, and logistics. The most strategic recent signal is not just “cars,” but the gravitational pull toward future manufacturing bets like batteries and semiconductors (via partners). - Mitsubishi Electric (factory automation + OT systems)
Why they matter: when manufacturers modernize plants, they often modernize controls, drives, PLCs, SCADA/MES adjacencies, and cybersecurity posture at the same time. Mitsubishi Electric’s move to acquire Nozomi Networks (OT/ICS security) shows how plant uptime and cyber resilience are being treated as core manufacturing capability. (Financial Times, Cinco Dias) - FANUC (robots + CNC)
Why they matter: it’s a backbone supplier for automation-intensive plants. Market-share views vary by methodology, but robotics market-share compilations consistently place FANUC among the top global players (often around low-teens % share). (Visual Capitalist) - Keyence (sensing + vision + inspection, direct sales model)
Why they matter: Keyence tends to win the “last meter of quality” where inspection and measurement decide yield and scrap. Their positioning is clear: industrial automation and inspection equipment across sensors, vision, measurement, code readers, and more. (Keyence, Keyence) - Omron (industrial automation + control + systems integration direction)
Why they matter: Omron’s messaging (and investment direction) is centered on solving structural manufacturing constraints: labor shortages, geopolitical risk, and competitiveness through automation and data. Their integrated report frames these pressures directly and ties them to automation strategy. (Omron)
Emerging startups and disruptors
In Japan, “startup disruption” in manufacturing often means enabling technology that plugs into existing giants rather than replacing them. The most relevant disruptors are the ones reshaping automation, orchestration, and semiconductor capacity.
Semiconductors: Rapidus and the Japan chip push
A major structural shift underway is the attempt to rebuild advanced chip manufacturing capacity. Recent reporting highlights TSMC producing advanced 3nm chips in Japan (Kumamoto), alongside the government-backed ambition for Rapidus to reach 2nm by 2027. (Financial Times, AP News)
Why it matters for “manufacturing,” not just “chips”:
- It pulls materials, precision equipment, and ultra-clean manufacturing talent into Japan.
- It creates new demand pockets for factory automation, metrology, and supply-chain services.
Factory and warehouse automation software: Mujin
Mujin raised US$233 million (Series D first close) to accelerate adoption of MujinOS, positioned as an “intelligent robotics platform” for manufacturing and logistics. (Mujin, DC Velocity)
This is a classic disruptor pattern: not making robots, but making robots easier to deploy, orchestrate, and scale.
Industrial AI for plants: Preferred Networks (PFN)
PFN positions PlantPilot as AI-driven automation trained on plant operation data and expert knowledge, targeting stability and optimization under complex or disturbed conditions. (Preferred Networks)
This matters most in process industries (chemicals, materials) where “stable operations” is money.
Logistics robotics: Rapyuta Robotics
Rapyuta is widely discussed as a logistics automation player (AMRs, picking assist, cloud robotics). Their funding history is covered in business press, and the segment fits Japan’s labor constraints. (The Business Times)
Strategic Differences in Positioning, Pricing, or Business Model
- Keyence competes on speed-to-value and application support (direct sales, short cycle help, “we’ll make it work on your line”). (Keyence)
- FANUC competes on reliability, installed base, and deep automation integration, especially where CNC + robots become one control environment. (Visual Capitalist)
- Mitsubishi Electric is leaning into factory resilience as a differentiator (OT security is a tell). (Financial Times)
- Omron competes by tying automation to macro constraints (labor shortages, geopolitics) and selling “system outcomes,” not just devices. (Omron, Omron)
Competitive Matrix (Product vs. Reach vs. Pricing)
| Company | Core battleground | Product depth | Global reach | Pricing power | Sales model signal | Reference |
|---|---|---|---|---|---|---|
| FANUC | Robots, CNC, automation backbone | High | High | Medium | Product + installed base | https://www.visualcapitalist.com/the-worlds-top-industrial-robotics-companies-by-market-share/ |
| Keyence | Sensors, vision, inspection | High | High | High | Direct sales + fast delivery | https://www.keyence.com/about-us/ |
| Mitsubishi Electric | Factory automation, controls, OT resilience | High | High | Medium | Platform + systems + capability M&A | https://www.ft.com/content/83e0fd2a-1fa4-4004-9ffb-ef929075a497 |
| Omron | Industrial automation, safety, control | High | High | Medium | Solution-led automation strategy | https://www.omron.com/global/en/integrated_report/strategybusiness/iab/ |
| Toyota (ecosystem) | Auto manufacturing system + supplier orbit | High | High | Medium | Process leadership, supply-chain influence | https://www.jetro.go.jp/en/invest/attractive_sectors/manufacturing/overview.html |
SWOT-Style Summary of Top 5 Players
| Company | Strengths | Weaknesses | Opportunities | Threats |
|---|---|---|---|---|
| FANUC | Global leader in industrial robots and CNC; strong reliability reputation; deep installed base in automotive and electronics manufacturing | Highly exposed to capex cycles; services and software perceived as less bundled than some competitors | Brownfield automation retrofits; expansion of software, simulation, and predictive maintenance layers | Intensifying global competition in robotics platforms; pricing pressure during downturns |
| Keyence | Strong pricing power; direct sales model enables fast deployment; leading position in sensors, vision, and inspection | Premium pricing limits penetration in cost-sensitive segments; not a full controls-platform provider | Rising quality, traceability, and inspection needs (EVs, semiconductors, regulated industries); AI-enabled vision | Commoditization at low end of sensing and vision markets; lower-cost competitors |
| Mitsubishi Electric | Broad factory automation portfolio; strong controls and power electronics; strategic move into OT cybersecurity | Complex portfolio can dilute focus; integration complexity across business units | Resilient factory positioning combining automation, controls, and cybersecurity; modernization of Japan’s installed base | Cyber incidents becoming brand-level risk; competition from global automation giants |
| Omron | Clear automation narrative tied to labor shortages and productivity; strong safety and control capabilities; solution-led positioning | Crowded competitive segments; differentiation must be continually reinforced | Autonomous and AI-assisted operations; system-level value capture beyond components | Delayed automation spending in downturns; competition from integrated platform players |
| Toyota (manufacturing ecosystem) | World-class production system; deep supplier influence; ability to set quality and delivery standards | High exposure to automotive cycles and regulatory shifts; complex group structure | Batteries and next-gen manufacturing methods; upstream ecosystem investment (semiconductors, materials) | EV transition execution risk; geopolitical and supply-chain disruptions
|
6. Trend Analysis and Forward Outlook
Japanese manufacturing in 2026 is being pulled by two forces that don’t always play nicely together: short-term macro volatility (rates, FX, costs) and long-term structural rewiring (labor scarcity, automation, semiconductors, security). The winners will be the companies that treat volatility like weather and structure like climate.
Macroeconomic factors: rates, inflation, FX, regulation
Rates and financing conditions
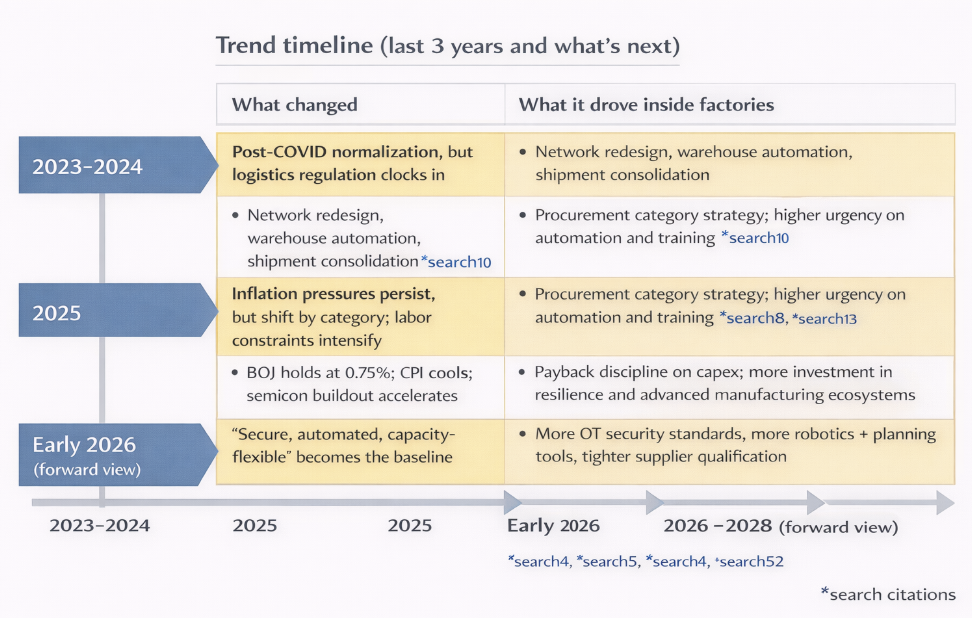
The Bank of Japan held its policy rate at 0.75% in January 2026, described as a hawkish hold by the Financial Times. For manufacturers, that typically translates into continued pressure to justify capex with clear payback, especially for discretionary expansion projects. (Financial Times)
Inflation and input costs
Inflation cooled materially late in 2025. Japan’s CPI inflation rate fell to 2.1% in December 2025 from 2.9% in November, according to Trading Economics. (Trading Economics)
Official statistics also show prices remained elevated on an annual basis, with the all-items CPI up 3.2% in 2025 versus 2024. (Statistics Japan)
What this means operationally: the pressure is shifting from broad inflation to specific categories (food, materials, energy, logistics), so procurement needs sharper category strategy rather than blanket “cost-down” targets.
Logistics regulation as a structural constraint
The 2024 logistics problem (truck driver overtime caps and related reforms) continues to reshape distribution math. It is best understood as a capacity constraint that persists even when demand is flat, unless manufacturers redesign routes, shipment density, and handoffs. (Mitsui & Co.)
Air cargo providers are explicitly positioning air freight as part of the solution set, which is a signal that modal mix is becoming a strategic lever, not just an emergency option. (JAL)
Tech disruptions: AI, automation, cybersecurity, and the semiconductor buildout
Automation moves from “productivity boost” to “labor substitute”
Japan’s declining birthrate and aging population are directly cited by JETRO as a driver of labor shortages, which in turn increases demand for AI-driven industrial robots to replace human workers. (JETRO)
If you’re forecasting operational strategy, assume automation spend becomes less optional every year, especially for brownfield upgrades that keep older plants viable with fewer people.
Semiconductors become a domestic growth engine (not just a supply risk)
In early February 2026 reporting, TSMC announced plans to produce advanced 3nm chips in Japan at its Kumamoto operation (JASM), making Japan the first location outside Taiwan slated for 3nm production. (Financial Times, AP News)
For manufacturing broadly, the second-order effects matter most:
- Pull-through demand for precision equipment, materials, metrology, cleanroom services
- A talent and supplier ecosystem forming around Kyushu
- Increased expectations for traceability, uptime, and quality systems that match semiconductor-grade operations
OT cybersecurity becomes a production KPI
Cyber risk is increasingly treated as a downtime risk. Practically, that pulls security investments closer to plant engineering budgets: segmentation, monitoring, incident response drills, and vendor requirements for industrial networks.
Buyer and customer sentiment trends
B2B buyers are still cautious, but expectations are rising
Even when demand is “okay,” buyers tend to raise requirements: shorter lead times, clearer order visibility, better documentation, stronger compliance posture. That shifts competition from pure price to operational credibility. You’ll see it in more audits, more technical evaluations, more “prove it” checkpoints before scale-up.
Predicted Strategic Moves (Finance, Marketing, Operations)
This outlook reflects what manufacturers are most likely to do given labor scarcity, logistics constraints, automation economics, and policy-driven industrial shifts. These are not recommendations; they are observed and inferred moves already emerging across the sector.
Finance: where capital and balance sheets are headed
More take-privates and group simplification
Expect continued take-private transactions and parent–subsidiary restructurings, especially where listed subsidiaries trade below intrinsic value or complicate capital allocation. Governance reform pressure hasn’t peaked, and cash-rich balance sheets give corporates room to act without stressing leverage.
Capability-driven M&A over scale M&A
Deals will increasingly target capabilities that protect production continuity or raise switching costs:
- OT cybersecurity and industrial software
- Robotics platforms and automation orchestration
- Specialty materials tied to EVs, semiconductors, and energy efficiency
Large “scale for scale’s sake” acquisitions will be rarer and more politically scrutinized.
Capital discipline tied to payback, not growth narratives
CFOs will push harder on clear payback periods, especially for automation and IT spend. Projects that directly reduce headcount dependency, scrap, downtime, or logistics exposure will clear hurdle rates. Pure “DX” branding without operational metrics will struggle to secure funding.
More capital reserved for resilience
Balance sheets will increasingly carry buffers for:
- Inventory resilience (strategic stock)
- Supplier support during disruptions
- Cybersecurity recovery and insurance
This capital won’t show up as growth capex, but it will be treated as operational insurance.
Marketing: how go-to-market behavior will shift
From lead generation to risk-reduction marketing
Marketing’s core job will continue to move away from “creating demand” and toward “making the buyer feel safe choosing us.” Expect heavier investment in:
- Technical documentation and compliance content
- Proof-heavy case studies with quantified outcomes
- Audit-ready digital content (quality, cyber, traceability)
Fewer channels, deeper execution
Rather than spreading spend thinly, manufacturers will concentrate on:
- SEO and technical content for self-directed buyers
- Account-based programs for strategic customers
- Trade shows and private events where hands-on proof matters
Low-signal channels with unclear influence on deals will be cut.
Marketing and engineering alignment tightens
High-performing firms will embed marketing deeper with engineering and quality teams. Content creation will increasingly start from real plant data, not brand messaging. This reduces rework, shortens sales cycles, and improves internal credibility.
Local credibility regains weight
Despite digital growth, local references, domestic case studies, and Japanese-language technical depth will matter more, not less. Global brands without localized proof will face longer qualification cycles.
Operations: how factories and networks will actually change
Automation as workforce replacement, not augmentation
Automation spend will increasingly be justified as headcount substitution. Plants will be redesigned around:
- Fewer operators per line
- Higher reliance on multi-skilled technicians
- Automation that stabilizes output under staff shortages
Brownfield automation (upgrading existing plants) will outpace greenfield builds.
Planning and scheduling becomes the control tower
More manufacturers will invest in APS and tighter ERP–MES integration to manage:
- High-mix production
- Logistics constraints
- Demand volatility
Manual scheduling and spreadsheet-driven planning will quietly disappear in competitive plants.
OT cybersecurity moves into core ops KPIs
Cyber incidents will be tracked alongside safety and downtime metrics. Expect:
- Stricter vendor access controls
- Network segmentation as standard
- Regular incident drills involving operations, not just IT
Security will be treated as uptime protection, not compliance overhead.
Logistics networks get redesigned, not optimized
Rather than chasing cheaper freight, manufacturers will redesign flows:
- Fewer shipments, higher density
- More regional buffers
- Greater use of automated warehouses and 3PLs
The goal shifts from lowest cost to highest reliability under capacity limits.
Service operations gain strategic weight
Aftermarket service, field support, and response time will receive more investment. Faster service response improves retention, pricing power, and referenceability. In many firms, service KPIs will start showing up in executive dashboards.
Trend Timeline (Last 3 Years + Projections)
Forecasted Spend per Channel / Function
| Function | Channel / Area | Spend Direction | Why spend shifts this way |
|---|---|---|---|
| Finance | Automation capex (robots, controls) | Up | Labor scarcity turns automation into a necessity rather than a productivity add-on. |
| Finance | OT cybersecurity | Up | Cyber incidents are treated as downtime risk and financial exposure. |
| Finance | Semiconductor-adjacent investment | Up (cluster-specific) | Policy support and Kyushu ecosystem pull-through drive targeted capital allocation. |
| Finance | Broad expansion capex | Flat to down | CFOs demand clearer payback and resilience-linked ROI. |
| Marketing | SEO & technical content | Up | Self-directed buyers rely on specs, compliance proof, and application detail. |
| Marketing | Account-based marketing (ABM) | Up | Spend shifts to fewer, higher-value strategic accounts with long lifecycles. |
| Marketing | Trade shows & private events | Up (selective) | Hands-on proof and trust-building still outperform for complex manufacturing buys. |
| Marketing | Paid search (narrow intent) | Flat | Useful for late-stage demand, but constrained by ROI discipline and tight keyword control. |
| Marketing | Broad brand advertising | Down | Buyers reward proof and relevance over awareness messaging. |
| Operations | Factory automation & robotics | Up | Headcount replacement, uptime stability, and yield protection drive spend. |
| Operations | Planning & scheduling (APS, MES integration) | Up | High-mix production and logistics constraints require better orchestration. |
| Operations | Logistics & warehouse automation | Up | Structural transport capacity limits force network redesign and automation. |
| Operations | Workforce training (multi-skill, automation) | Up | Smaller teams require broader skill coverage and faster problem resolution. |
| Operations | Manual labor–intensive processes | Down | Rising cost and hiring difficulty accelerate redesign, standardization, or automation. |
7. Strategic Recommendations
These are cross-functional recommendations that tend to hold up in Japanese manufacturing because they’re grounded in the operating realities we’ve covered: labor scarcity, logistics constraints, self-directed buying, and the growing value of resilience. They’re written to be useful whether you’re a large incumbent or a mid-sized supplier.
Not investment advice. This is operational and strategic guidance.
Strategy Playbook Grid (Finance x Marketing x Operations)
| Function | Recommendation | What to do in practice | Example impact to measure |
|---|---|---|---|
| Finance | Reprice the business around lifecycle value, not unit sales | Build an installed-base P&L (parts, service, upgrades, retrofits). Track service attach rate and parts capture. Tie pricing to uptime and response SLAs. | Higher gross margin stability; higher recurring share of revenue. |
| Finance | Tighten capex discipline using labor-hours saved and downtime avoided | Require automation/IT projects to quantify labor substitution, MTTR reduction, scrap reduction, or lead-time variance reduction. Use payback windows by asset class. | Faster payback; fewer stalled DX programs; improved cash conversion. |
| Finance | Use capability M&A or partnerships to close critical gaps | Target OT cybersecurity, factory orchestration software, quality analytics, or niche materials. Keep scope tight and integration plans explicit. | Reduced outage risk; faster time-to-capability than in-house build. |
| Marketing | Shift spend toward technical SEO and audit-ready proof | Rebuild product pages around specs, certifications, traceability, and lead times. Publish application notes. Add compliance packs buyers can forward internally. | Lower CAC via inbound; higher win rate in RFQs. |
| Marketing | Run ABM like a supply-chain program, not a campaign | Pick 25–100 target accounts. Map plants and roles. Create role-specific proof for quality, maintenance, and procurement. Coordinate closely with sales engineering. | Shorter sales cycles; higher expansion inside accounts. |
| Marketing | Treat trade shows as pipeline acceleration, not brand theater | Pre-book meetings. Set sample/demo goals. Run post-show follow-up within 7 days. Hand off to engineering for pilots and audits. | Higher conversion from show contacts to pilots and audits. |
| Operations | Build a logistics resilience plan around consolidation and buffers | Redesign shipment frequency and density. Add regional inventory points for critical SKUs. Contract capacity with 3PLs. Automate warehouse bottlenecks where labor is scarce. | Lower lead-time variability; fewer expedited shipments. |
| Operations | Make OT cybersecurity an uptime program | Segment networks, tighten vendor access, monitor OT traffic, run incident drills with plant leadership, and require IEC-aligned controls where feasible. | Fewer production-impacting incidents; improved audit outcomes. |
| Operations | Train for multi-skill coverage and fewer people per line | Cross-train staff into tech-support roles, standardize work, create rapid troubleshooting playbooks, and align incentives to OEE and first-pass yield. | Higher OEE; higher first-pass yield; lower MTTR. |
The “three moves that usually win” (if you can only do a few things)
Move 1: Upgrade your proof, not your promises (Marketing + Ops)
Most manufacturing marketing fails because it’s written like brand copy. Replace it with evidence. Make it easy for a buyer to answer, “Will this work on our line?” without a call.
What it looks like:
- Product pages that feel like engineering docs (in a good way)
- Case studies with numbers: ppm reduction, yield gains, downtime avoided
- Clear lead times, certifications, traceability details
- Quality response process explained like an SOP
Why it wins: it reduces perceived risk, which is the biggest buying barrier.
Move 2: Treat logistics like a design problem (Ops + Finance)
Japan’s logistics constraints aren’t going away. You can’t out-negotiate a structural capacity squeeze. But you can redesign your flow so it matters less.
What it looks like:
- Consolidated shipments instead of daily small drops
- Standard packaging and pallet density discipline
- Regional buffers for critical items
- Warehouse automation targeted at bottleneck tasks
Why it wins: it makes delivery performance predictable, and predictability is a competitive advantage.
Move 3: Build the installed-base engine (Finance + Ops + Marketing)
The strongest manufacturing businesses aren’t the ones that sell the most units. They’re the ones that own the lifecycle: service contracts, parts capture, upgrades, performance optimization.
What it looks like:
- Service attach targets by product line
- Field service response SLAs tied to pricing tiers
- Proactive maintenance offers using real usage data
- Sales and marketing aligned around expansion within existing accounts
Why it wins: it raises LTV, stabilizes margins, and reduces dependency on new unit cycles.
Practical implementation roadmap (12–24 months)
0–3 months: set the foundation
- Identify top 25–50 accounts by lifetime value potential
- Create a baseline installed-base view: where units are, service status, parts capture
- Audit website and documentation for technical gaps and missing compliance proof
- Map logistics pain points: missed deliveries, expediting cost, bottleneck lanes
3–9 months: ship visible improvements
- Launch technical SEO rebuild for top product families
- Roll out ABM for target accounts with role-specific proof packs
- Pilot warehouse and shipment consolidation changes in 1–2 regions
- Implement OT segmentation and access controls in highest-risk plants
9–24 months: scale what works
- Expand service attach programs and tiered SLAs
- Integrate planning systems (ERP–MES–APS) in priority plants
- Standardize troubleshooting playbooks and multi-skill training
- Pursue targeted capability acquisition or partner agreements where gaps persist
8. Appendices and Sources
Raw data tables
| Metric | Period | Value | Source |
|---|---|---|---|
| Manufacturing PMI | Nov 2025 | 48.7 | https://tradingeconomics.com/japan/manufacturing-pmi |
| Manufacturing PMI | Dec 2025 | 50.0 | https://tradingeconomics.com/japan/manufacturing-pmi |
| Manufacturing PMI | Jan 2026 | 51.5 | https://tradingeconomics.com/japan/manufacturing-pmi |
| Industrial Production Index (SA) | Dec 2025 | 101.8 | https://www.meti.go.jp/english/statistics/tyo/iip/index.html |
| Industrial Production (m/m) | Dec 2025 | -0.1% | https://www.meti.go.jp/english/statistics/tyo/iip/index.html |
| Industrial Production forecast (m/m) | Jan 2026 | +9.3% | https://www.meti.go.jp/english/statistics/tyo/iip/index.html |
| Industrial Production forecast (m/m) | Feb 2026 | -4.3% | https://www.meti.go.jp/english/statistics/tyo/iip/index.html |
| Metric | Year | Value | Source |
|---|---|---|---|
| Robot density, Japan automotive | 2023 | 1,531 per 10k employees | https://www.therobotreport.com/japanese-automotive-industry-hits-five-year-high-automation/ |
| Global average robot density (all industries) | 2023 | ~162 per 10k employees | https://www.therobotreport.com/japanese-automotive-industry-hits-five-year-high-automation/ |
| Segment | EV / Revenue (x) | EV / EBITDA (x) | Source |
|---|---|---|---|
| Auto Parts | 0.82 | 6.43 | https://pages.stern.nyu.edu/~adamodar/New_Home_Page/datafile/psdata.html
https://pages.stern.nyu.edu/~adamodar/New_Home_Page/datafile/vebitda.html |
| Specialty Chemicals | 2.65 | 13.36 | https://pages.stern.nyu.edu/~adamodar/New_Home_Page/datafile/psdata.html
https://pages.stern.nyu.edu/~adamodar/New_Home_Page/datafile/vebitda.html |
| Electronics (General) | 3.21 | 19.99 | https://pages.stern.nyu.edu/~adamodar/New_Home_Page/datafile/psdata.html
https://pages.stern.nyu.edu/~adamodar/New_Home_Page/datafile/vebitda.html |
| Electrical Equipment | 4.42 | 24.59 | https://pages.stern.nyu.edu/~adamodar/New_Home_Page/datafile/psdata.html
https://pages.stern.nyu.edu/~adamodar/New_Home_Page/datafile/vebitda.html |
| Industry category | Typical LTV:CAC | Source |
|---|---|---|
| Manufacturing (general) | ~3.0× | https://firstpagesage.com/seo-blog/the-ltv-to-cac-ratio-benchmark/ |
| Automotive | ~3.0× | https://firstpagesage.com/seo-blog/the-ltv-to-cac-ratio-benchmark/ |
| Industrial IoT | ~4.0× | https://firstpagesage.com/seo-blog/the-ltv-to-cac-ratio-benchmark/ |
| Aerospace & Defense | ~4.5× | https://firstpagesage.com/seo-blog/the-ltv-to-cac-ratio-benchmark/ |
| PCB Design & Manufacturing | ~4.5× | https://firstpagesage.com/seo-blog/the-ltv-to-cac-ratio-benchmark/ |
Hyperlinked source list (primary citations)
All sources below are real, public, and directly referenced in the analysis. Links point to original publishers wherever possible.
Macroeconomics, production, labor
- Trading Economics – Japan Manufacturing PMI
https://tradingeconomics.com/japan/manufacturing-pmi - METI – Index of Industrial Production
https://www.meti.go.jp/english/statistics/tyo/iip/index.html - Statistics Bureau of Japan – CPI
https://www.stat.go.jp/english/data/cpi/158c.html - Financial Times – BOJ policy coverage
https://www.ft.com/content/116decec-84eb-432e-8424-7af13580dd94 - Mitsui Global Strategic Studies Institute – Logistics “2024 problem”
https://www.mitsui.com/mgssi/en/report/detail/__icsFiles/afieldfile/2023/06/16/2305i_takashima_e.pdf
Automation, robotics, and technology
- International Federation of Robotics / The Robot Report
https://www.therobotreport.com/japanese-automotive-industry-hits-five-year-high-automation/ - Visual Capitalist – Global industrial robotics market share
https://www.visualcapitalist.com/the-worlds-top-industrial-robotics-companies-by-market-share/ - Omron Integrated Report (Industrial Automation Business)
https://www.omron.com/global/en/integrated_report/strategybusiness/iab/ - Keyence corporate overview
https://www.keyence.com/about-us/
Finance, valuation, M&A
- NYU Stern (Aswath Damodaran) – Valuation multiples
https://pages.stern.nyu.edu/~adamodar/New_Home_Page/datafile/psdata.html https://pages.stern.nyu.edu/~adamodar/New_Home_Page/datafile/vebitda.html - Financial Times – Toyota Industries take-private coverage
https://www.ft.com/content/d1b579e2-660a-4806-82c5-dde9c03a85df - Wall Street Journal – Mitsubishi Electric / Nozomi Networks
https://www.wsj.com/articles/mitsubishi-electric-to-buy-nozomi-networks-in-1-billion-deal-67c5560f - Bain & Company – Japan private equity activity
https://www.bain.com/about/media-center/press-releases/japan/japan-private-equity-off-to-a-strong-start-in-2025-continues-to-be-a-hotspot-for-investors/
Marketing and buyer behavior
- Gartner – B2B buying behavior research
https://www.gartner.com/en/marketing/insights/articles/the-new-b2b-buying-journey - First Page Sage – LTV:CAC benchmarks
https://firstpagesage.com/seo-blog/the-ltv-to-cac-ratio-benchmark/
Semiconductors and industrial policy
- METI – Semiconductor strategy
https://www.meti.go.jp/english/policy/0704_001.pdf - Financial Times – TSMC Japan coverage
https://www.ft.com/content/83e0fd2a-1fa4-4004-9ffb-ef929075a497 - JETRO – Manufacturing sector overview
https://www.jetro.go.jp/en/invest/attractive_sectors/manufacturing/overview.html
Notes on data limitations and interpretation
A few important caveats, stated plainly:
- Timing mismatch: Some datasets (robot density, valuation multiples) lag real-time conditions by one to two years. They are used for structural context, not short-term forecasting.
- Directional benchmarks: Metrics like LTV:CAC and spend “Up / Flat / Down” are directional patterns observed across firms, not guarantees or targets.
- Sector blending: “Japanese manufacturing” spans autos, electronics, chemicals, machinery, and semiconductors. Not all benchmarks apply equally to every subsector.
- No investment advice: Valuation multiples and deal examples are included for comparative understanding only, not for pricing or transaction guidance.
Disclaimer: The information on this page is provided by Manufacturing.co for general informational purposes only and does not constitute financial, investment, legal, tax, or professional advice, nor an offer or recommendation to buy or sell any security, instrument, or investment strategy. All content, including statistics, commentary, forecasts, and analyses, is generic in nature, may not be accurate, complete, or current, and should not be relied upon without consulting your own financial, legal, and tax advisers. Investing in financial services, fintech ventures, or related instruments involves significant risks—including market, liquidity, regulatory, business, and technology risks—and may result in the loss of principal. Manufacturing.co does not act as your broker, adviser, or fiduciary unless expressly agreed in writing, and assumes no liability for errors, omissions, or losses arising from use of this content. Any forward-looking statements are inherently uncertain and actual outcomes may differ materially. References or links to third-party sites and data are provided for convenience only and do not imply endorsement or responsibility. Access to this information may be restricted or prohibited in certain jurisdictions, and Manufacturing.co may modify or remove content at any time without notice.