Market Research
The State of French Manufacturing Market Research Report
1. Industry Overview and Executive Summary
Size, growth, macro outlook
French manufacturing is in a “quiet rebuild” phase. Not a dramatic comeback, not a collapse either. Capacity and investment have been rising in pockets, but demand has been uneven, and that mismatch is the story you keep seeing in the data. A few anchor datapoints to ground the conversation:- Manufacturing value added was about 9.43% of France’s GDP in 2024 (World Bank). https://data.worldbank.org/indicator/NV.IND.MANF.ZS?locations=FR
- In EU context, France represented about 12% of the EU’s value of sold production in 2024, ranking behind Germany and Italy (Eurostat). https://ec.europa.eu/eurostat/statistics-explained/index.php/Industrial_production_statistics
- Production remains below pre-Covid levels. France’s Treasury reported that in 2024 manufacturing output was still below 2019 (about -3.2%), even though capital stock and employment increased. That’s the clearest “demand is the bottleneck” tell you can ask for. https://www.tresor.economie.gouv.fr/Articles/2025/09/29/flash-conjoncture-france-evolution-des-capacites-de-production-industrielles-depuis-la-crise-sanitaire
- Short-term momentum improved entering 2026. S&P Global’s January 2026 PMI release described the quickest rise in output in nearly four years, alongside stronger confidence. https://www.pmi.spglobal.com/Public/Home/PressRelease/a94ad8549af940068d8643db0ad6cb28
- Reindustrialization continues, but at a slower pace. The French State’s Industrial Barometer counted net +89 industrial site openings in 2024, down from +176 in 2022 and +189 in 2023. https://www.entreprises.gouv.fr/files/files/Publications/2025/Etudes/202503-barometre-industriel-etat.pdf
- One side: strategic investment, new sites, and bigger capex commitments that assume a multi-year runway.
- The other side: buyers stretching decisions, pushing out programs, and forcing manufacturers to fight for utilization.
Key drivers of industry growth
1. Reindustrialization and sovereign capacity building France is not leaving industrial capacity to the market alone. Public policy and public finance are actively shaping what gets built and where.- France 2030 is a €54B plan aimed at strategic sectors and industrial sovereignty, designed to pull innovation into production. https://www.info.gouv.fr/grand-dossier/france-2030-en/understanding-france-2030
- Bpifrance reports large-scale support for industrialization. In 2024 it tracked 3,200 industrial startups, said industrial startups raised €2.83B across 212 rounds, and reported €3.7B deployed in financing industrialization (including France 2030-directed funding). https://analysesindustriefrance.fr/ and https://presse.bpifrance.fr/bpifrance-publie-la-troisieme-edition-de-son-observatoire-annuel-des-startups-pme-et-eti-industrielles-francaises-qui-confirme-la-resilience-de-lecosysteme-industriel-avec-115-inaugurations-de-sites
Cross-functional summary (finance, marketing, ops)
Finance
- Capital is flowing, but it’s pickier. Public finance is a stabilizer. France 2030 and Bpifrance are meaningful parts of the industrial funding stack, not side characters. https://www.info.gouv.fr/grand-dossier/france-2030-en/understanding-france-2030 and https://presse.bpifrance.fr/bpifrance-publie-la-troisieme-edition-de-son-observatoire-annuel-des-startups-pme-et-eti-industrielles-francaises-qui-confirme-la-resilience-de-lecosysteme-industriel-avec-115-inaugurations-de-sites
- Reindustrialization is still positive in net terms, but the slowdown in net openings suggests the “easy wins” are done and the next wave is harder: permitting, talent, energy economics, and demand certainty. https://www.entreprises.gouv.fr/files/files/Publications/2025/Etudes/202503-barometre-industriel-etat.pdf
- Under the hood, profitability signals are mixed by subsector, but Insee notes the manufacturing sector’s margin rate in 2023 was around 4 points above pre-crisis, suggesting companies defended margins through the shock period. https://www.insee.fr/en/statistiques/8227442?sommaire=8227460
Marketing
- Industrial buyers increasingly want to self-educate and self-qualify vendors before talking to anyone. Gartner reports 61% of B2B buyers prefer a rep-free buying experience. That is an uncomfortably big number if your website is still basically a brochure. https://www.gartner.com/en/newsroom/press-releases/2025-06-25-gartner-sales-survey-finds-61-percent-of-b2b-buyers-prefer-a-rep-free-buying-experience
- Omnichannel is now table stakes. McKinsey’s B2B research emphasizes that winners make it easy for customers to move between channels without losing context. https://www.mckinsey.com/capabilities/growth-marketing-and-sales/our-insights/five-fundamental-truths-how-b2b-winners-keep-growing
Operations
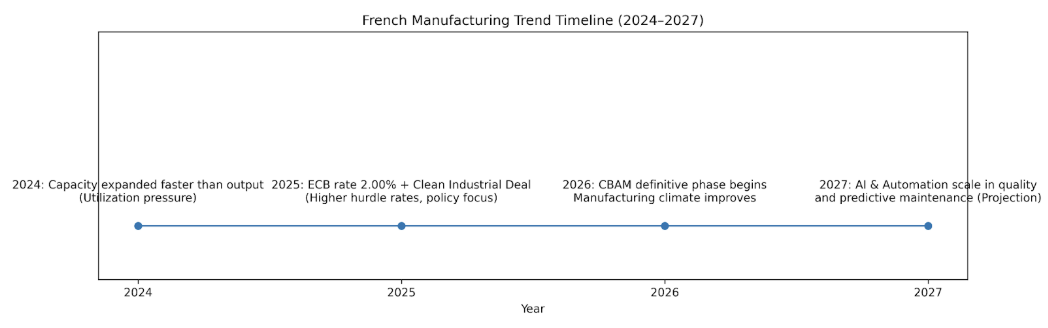
- Capacity expanded faster than demand. France’s Treasury points to rising capital stock and employment even while production stayed below 2019 in 2024. This is why operational leaders are so focused on utilization, lead-time credibility, and cost control right now. https://www.tresor.economie.gouv.fr/Articles/2025/09/29/flash-conjoncture-france-evolution-des-capacites-de-production-industrielles-depuis-la-crise-sanitaire
- Logistics performance is not one story either. Some corridors look healthier. HAROPA PORT reported a 2025 container record of 3.2M TEU (+4%), which matters for import/export-heavy manufacturers. https://www.haropaport.com/en/news/record-traffic-and-growing-modal-share-2025-seine-corridor
- Cost pressure persists outside fuel. CNR reports non-fuel road freight operating costs rising about 5.5% year over year in 2024. That keeps landed-cost volatility high even when fuel calms down. https://www.cnr.fr/conjoncture-economique-et-couts-du-transport-routier-octobre-2024
Industry Snapshot Table
| Metric | Latest signal | What it implies | Source |
|---|---|---|---|
| Manufacturing value added (% of GDP) | 9.43% (2024) | France is a major industrial economy, but manufacturing is a minority share of GDP | World Bank |
| France share of EU value of sold production | 12% (2024) | Strong EU position, but not top 2 | Eurostat |
| Net industrial site openings | +89 (2024) vs +189 (2023) | Reindustrialization continues, momentum cooled | Baromètre industriel de l’État (March 2025) |
| Industrial startup funding | €2.83B raised (2024) | Innovation pipeline is active, but still needs scaling-to-factory support | Observatoire annuel des startups, PME & ETI industrielles |
| Bpifrance industrialization financing | €3.7B deployed (2024) | Public finance is structurally important to capex | Bpifrance press release / observatory |
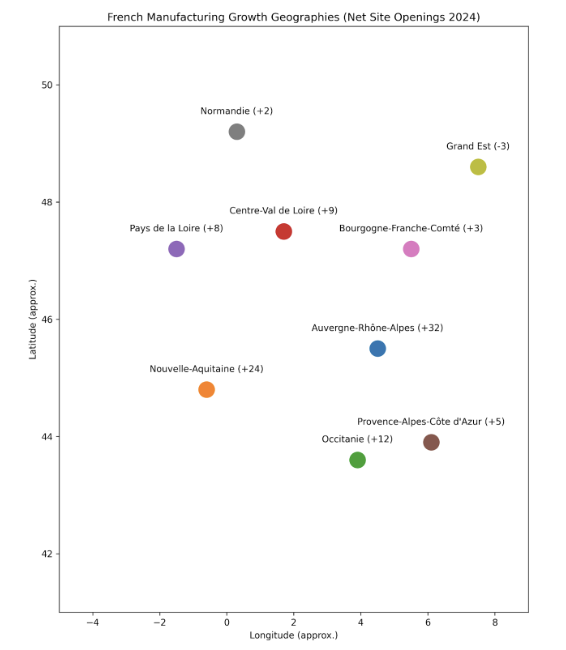
Global Hubs or Growth Geographies
2. Finance and Investment Landscape
If Section 1 was about scale and direction, Section 2 is about the fuel in the tank. Who is writing the checks? Where are assets changing hands? And what do the numbers say about resilience versus risk? French manufacturing finance right now is defined by three forces at the same time:- Strategic consolidation in complex industries (especially aerospace and energy-linked systems)
- Strong public-sector capital support for industrialization
- A private capital market that is more selective than it was in 2021–2022
Recent M&A activity
The most active deals cluster around capability capture, supply chain control, and energy transition infrastructure. This is not random. These are areas where industrial risk feels existential rather than cyclical.Deal Table
| Buyer | Seller / Asset | Deal Value | Date | Strategic Rationale | Source |
|---|---|---|---|---|---|
| Alfa Laval | Fives Cryogenics business | €800M (fixed price) | Announced Mar 2025 | Cryogenic heat transfer & pump systems for energy transition and industrial gas markets | Alfa Laval press release |
| Safran | Collins Aerospace flight control & actuation activities | Not disclosed (closing announced Jul 2025) | 2025 | Strengthens aerospace systems footprint and vertical integration | Safran press release |
| Airbus | Spirit AeroSystems European assets (commercial aircraft programs) | Not disclosed (closed Dec 2025) | 2025 | Secures industrial capacity and de-risks supply chain | Airbus press release |
| French State | Atos advanced computing division | €410M (incl. conditional) | Announced Jun 2025 | Strategic/sensitive computing capability retention | Le Monde (English) |
| Schneider Electric | Motivair (liquid cooling systems) | Not disclosed (closed Feb 2025) | 2025 | Strengthens cooling stack for high-performance compute and industrial digitization | Schneider Electric PDF |
- Aerospace remains structurally strategic. Vertical integration and subsystem control are not short-term plays; they are multi-cycle risk hedges.
- Energy and cooling infrastructure are investable themes. Cryogenics and liquid cooling aren’t niche anymore; they’re core to energy transition and high-performance compute ecosystems.
- The French State is willing to step in where assets are considered strategically sensitive.
Investment trends: PE, VC, public capital
Public capital is not peripheral in France’s industrial story. It is central. France 2030- €54B national investment plan targeting innovation, decarbonization, health, digital, and industrial sovereignty. Source: https://www.info.gouv.fr/grand-dossier/france-2030-en/understanding-france-2030
- 3,200 industrial startups tracked
- €2.83B raised across 212 rounds
- 115 industrial sites inaugurated (startups + SMEs/ETIs)
- €3.7B deployed in financing industrialization (incl. France 2030 directed funding)
- 1,688 foreign investment decisions in 2024
- Down 7% vs 2023, but still above pre-Covid levels
- “Production” represented 28% of decisions, the largest category
Revenue models and unit economics
French manufacturing includes very different economic models. Lumping them together hides more than it reveals. It’s more useful to think in archetypes. Archetype 1: Capital-intensive OEM manufacturing Revenue profile:- Project-based or batch production
- Often cyclical, linked to macro demand
- Highly sensitive to utilization
- Raw material and energy cost pass-through is critical
- Hardware + software + services
- Recurring maintenance and support
Financial health indicators
Key macro-financial signals shaping French manufacturers today:- Demand gap vs capacity The Treasury highlights that capital stock and employment rose while production remained below 2019 levels in 2024. That mismatch pressures working capital and utilization rates.
- Business climate pulse Banque de France’s monthly business survey tracks short-term confidence and order books. These reports are closely watched by CFOs and banks.
- Logistics cost structure CNR notes that non-fuel operating costs in road freight rose about 5.5% year over year in 2024, even as diesel prices moderated. This affects gross margin if not priced in.
LTV:CAC Ratio Chart
| LTV:CAC ratio range | Label | What it usually signals | Common next move |
|---|---|---|---|
| < 1.0x | Weak | You’re spending more to acquire customers than you reasonably earn back (or retention/margins are too low). | Fix retention and gross margin first; tighten targeting; stop low-quality channels. |
| 1.0x–3.0x | Acceptable | Unit economics may work, but you’re living on execution quality. Payback period matters a lot here. | Improve conversion (site, sales process), reduce sales cycle friction, raise expansion/renewal. |
| 3.0x–5.0x | Strong | Healthy unit economics in many subscription-like models; usually indicates good retention and/or efficient acquisition. | Scale carefully; protect lead quality; invest in customer success to defend LTV. |
| > 5.0x | Elite | Often very strong retention/expansion, or you may be under-investing in growth (ratio looks “too good”). | Check if you’re leaving growth on the table; test incremental spend while monitoring payback. |
Source for the commonly cited 3x reference benchmark: Altior (CLTV:CAC ratio)
EV/Revenue + EV/EBITDA Multiples
| Subsector Archetype | Typical Growth Profile | EV / Revenue (x) | EV / EBITDA (x) | Drivers of Premium / Discount |
|---|---|---|---|---|
| Aerospace & Defense Suppliers (Tier-1 / Tier-2) | Mid-single to low-double digit, cyclical with backlog support | 1.5x – 3.5x | 10x – 16x | Backlog visibility, certification barriers, margin stability, exposure to commercial aircraft cycles |
| Industrial Automation & Controls | High-single to mid-teens, structural digitization tailwind | 2.5x – 5.0x | 14x – 22x | Recurring software mix, installed base leverage, global footprint |
| Capital Goods / Heavy Equipment | Low to mid-single digit, highly cyclical | 0.8x – 2.0x | 7x – 12x | Order cyclicality, commodity exposure, operating leverage risk |
| Specialty Chemicals / Advanced Materials | Mid-single digit, margin-sensitive to input costs | 1.5x – 3.0x | 9x – 15x | Pricing power, feedstock volatility, regulatory exposure |
| Automotive Components | Flat to low growth, transition risk (EV shift) | 0.4x – 1.2x | 4x – 8x | OEM pricing pressure, platform concentration, EV repositioning risk |
| Industrial Technology (Hardware + Software Hybrid) | Double-digit growth potential | 3.0x – 7.0x | 15x – 25x+ | Recurring revenue mix, gross margin profile, SaaS-style retention metrics |
Notes:
• EV = Enterprise Value (equity value + net debt). • Multiples compress in high-rate environments and expand when growth visibility improves. • Within each band, margin profile and recurring revenue mix are typically more influential than headline revenue growth alone.3. Marketing performance and trends
If finance is about capital allocation, marketing in French manufacturing is about credibility allocation. Industrial buyers are cautious, cross-functional, and increasingly self-directed. The biggest shift in the last five years is not “digital marketing adoption.” It’s that engineers and procurement teams now expect to evaluate vendors independently before talking to sales.Channel breakdown: what’s working and why
Two external signals frame the current environment:- 61% of B2B buyers prefer a rep-free buying experience, according to Gartner. That means they want to research, compare, validate, and shortlist vendors before interacting with sales. Source: https://www.gartner.com/en/newsroom/press-releases/2025-06-25-gartner-sales-survey-finds-61-percent-of-b2b-buyers-prefer-a-rep-free-buying-experience
- McKinsey’s B2B research shows that high performers build true omnichannel journeys, allowing customers to move seamlessly between digital and human interactions. Source: https://www.mckinsey.com/capabilities/growth-marketing-and-sales/our-insights/five-fundamental-truths-how-b2b-winners-keep-growing
Multi-Channel Performance Table
| Channel | Primary Role | Relative CAC Profile | Strengths | Common Failure Mode |
|---|---|---|---|---|
| SEO + technical content | Early-stage research, spec validation | Low over time | High-intent inbound, long-tail problem capture | Publishing generic content with no technical depth |
| Paid search (Google/Bing) | High-intent RFQs, urgent retrofit needs | Moderate | Fast feedback loop, scalable | Sending traffic to non-technical landing pages |
| LinkedIn (paid + organic) | Brand credibility, ABM-lite | Moderate to high | Strong for targeting specific roles/companies | Overly corporate messaging, no concrete proof |
| Email (nurture + reactivation) | Long sales cycles, multi-stakeholder buying | Low (if list quality is strong) | Drives deal progression, maintains mindshare | One-size-fits-all drip sequences |
| Trade shows & industry events | Relationship building, product demos | High | High-quality conversations, trust-building | Poor follow-up discipline post-event |
| Distributor & partner channels | Geographic and segment coverage | Variable | Local trust, speed to market | Weak attribution and shared pipeline visibility |
- Pages include specifications, certifications, tolerances, and performance curves.
- Engineers can download technical documentation without excessive friction.
- Content addresses real use cases (e.g., “reduce scrap in aluminum casting by X%”) rather than generic brand narratives.
Buyer behavior trends
Industrial buying groups have become more complex. Three structural shifts: 1. Self-directed research is the default With 61% preferring rep-free experiences (Gartner), product pages function as silent sales engineers. 2. Cross-functional decision-making Plant managers, engineers, procurement, sustainability officers, and finance may all influence decisions. Messaging must address:- Technical feasibility (engineers)
- Total cost of ownership (procurement/finance)
- Compliance and emissions (sustainability)
- Uptime and risk (operations)
- Lead time reliability
- Local or regional production footprint
- Dual sourcing
- Service availability
Creative and messaging that performs best
In French manufacturing, the messaging that converts is not flashy. It’s specific. High-performing messaging patterns:- Quantified impact: “Reduced downtime by 18% across three plants.”
- Measurable performance: “Energy consumption: 2.3 kWh per cycle (validated on Line X).”
- Lead time transparency: “Standard configurations shipped within 4–6 weeks.”
- Compliance clarity: “ISO/EN/AS certifications listed and downloadable.”
- Overuse of innovation language without proof.
- Vague sustainability claims without measurable metrics.
- Corporate brand videos that never show the product in action.
Market positioning and brand perception
French industrial brands that perform well internationally tend to position around:- Engineering rigor
- Reliability and longevity
- Compliance and safety
- Service infrastructure
- Factory tours (physical or video)
- Case studies with named customers (where possible)
- Technical white papers and validation documentation
- Transparent warranty and service commitments
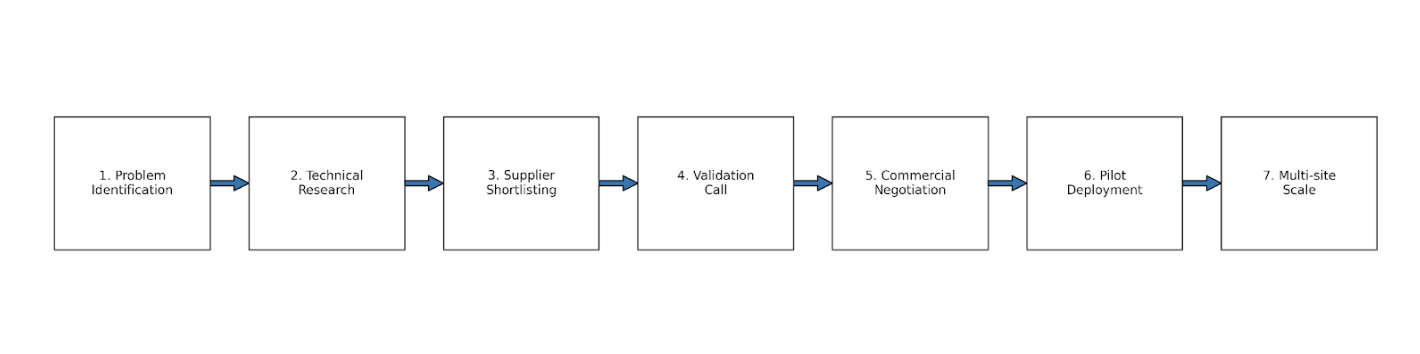
Journey Diagram
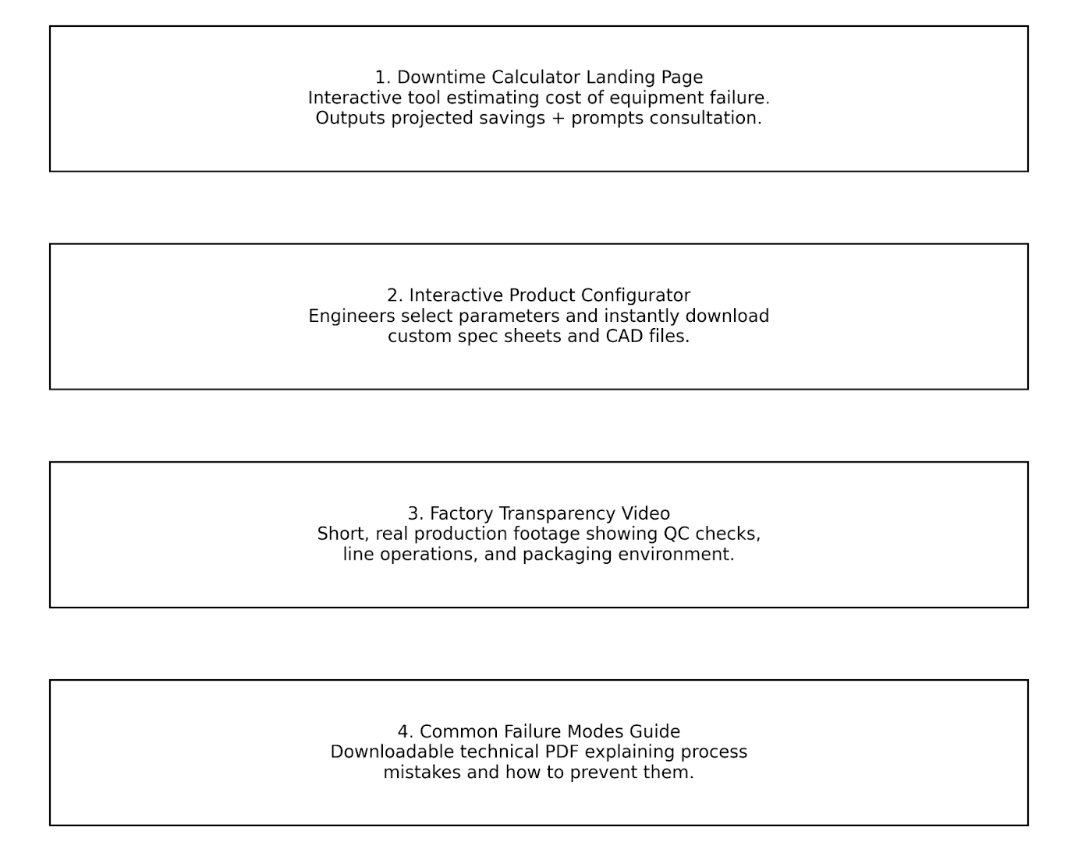
Swipe File: Campaign Examples
4. Operational Benchmarking
If finance is about capital and marketing is about demand, operations is where the promise either holds… or breaks. French manufacturing in 2026 is operationally stronger than it was pre-Covid in some ways (capacity, policy support, digital tooling), but more exposed in others (cost volatility, demand softness, regulatory burden). The gap between high-performing operators and average ones has widened. This section breaks down supply chain, workforce, tech stack, fulfillment, and regulatory realities.Supply chain and logistics
Throughput is improving. Costs are not fully cooperating. Port and corridor performance HAROPA PORT (Le Havre–Rouen–Paris corridor) reported over 3.2 million TEU handled in 2025, up 4% year over year. Hinterland traffic reached 2.3 million TEU (+4%). That’s a sign of corridor stability and trade normalization. Source: https://www.haropaport.com/en/news/record-traffic-and-growing-modal-share-2025-seine-corridor What that means operationally:- Exporters benefit from more predictable maritime flow.
- Inland logistics and multimodal coordination matter more than pure port capacity.
- Even when energy prices cool, structural cost pressure persists (labor, insurance, maintenance).
- Contract structures need indexed pricing or margin compression is likely.
- Supplier diversification and regionalization are strategic priorities.
- French plants benefit when positioned as reliable EU anchors.
Workforce structure and hiring trends
Labor tension has eased from peak crisis levels, but skill scarcity hasn’t disappeared. France’s Treasury noted that recruitment tensions were very strong in 2022–2023 and have since clearly eased, while employment in manufacturing continued to rise partly due to apprenticeship growth. Source: https://www.tresor.economie.gouv.fr/Articles/2025/09/29/flash-conjoncture-france-evolution-des-capacites-de-production-industrielles-depuis-la-crise-sanitaire What that means on the floor:- Hiring is easier than two years ago.
- Experienced technicians and automation engineers remain constrained.
- Apprenticeships are structurally important to workforce renewal.
| Function | Typical Focus | Structural Trend |
|---|---|---|
| Production operators | Line execution, quality checks | Automation reducing repetitive roles, increasing technical skill requirements |
| Maintenance technicians | Preventive + predictive maintenance | Shift toward data-driven maintenance (sensors, CMMS integration) |
| Process engineers | Yield optimization, integration | Increasing cross-functional role (quality + digital tools) |
| Supply chain planners | Inventory + supplier coordination | Higher emphasis on resilience over pure lean |
| Sales engineers | Technical pre-sales | Closer integration with marketing content |
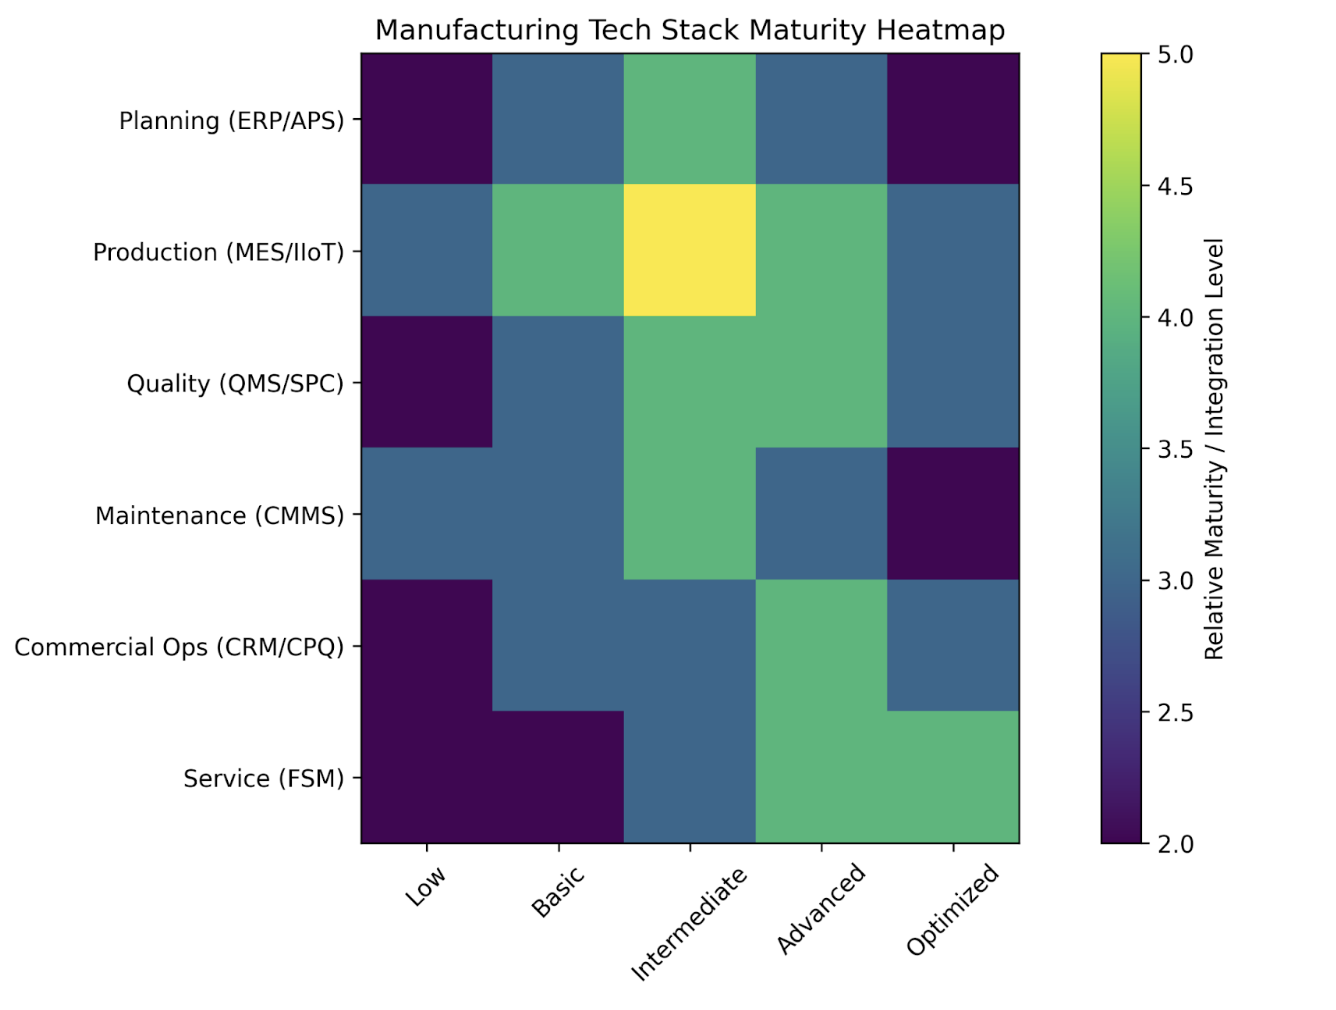
Tech stack benchmarking
The “modern” French industrial stack is layered, not monolithic. Core backbone:- ERP for finance, procurement, and high-level planning
- MES or production monitoring tools per plant
- QMS for compliance-heavy industries
- CMMS for maintenance tracking
Teck Stack Heatmap
Fulfillment and customer service strategies
Top-performing manufacturers increasingly behave like service companies. Common best practices:- Spare parts localization Stock positioned close to demand nodes reduces downtime risk and strengthens renewal revenue.
- Remote diagnostics First response via remote monitoring reduces truck rolls and speeds resolution.
- SLA-backed service Formal service-level agreements with measurable response times increase perceived reliability.
- Structured onboarding Commissioning programs that transition from installation to steady-state optimization reduce early churn.
Regulatory and compliance hurdles
France’s regulatory environment is sophisticated and structured. That’s good for long-term stability, but it increases planning complexity. Key friction points:- ICPE environmental permitting for industrial sites.
- Emissions and decarbonization reporting requirements cascading down supply chains.
- Sector-specific certification (aerospace, medical, automotive) extending time to production.
Ops KPI Table
| KPI | Typical Range (varies by subsector) | Why It Matters |
|---|---|---|
| On-time, in-full (OTIF) | 90%–98% | Direct impact on customer trust and repeat business |
| OEE (Overall Equipment Effectiveness) | 60%–85% | Capacity utilization and loss visibility (availability, performance, quality) |
| Inventory turns | 4–10 turns/year | Balances cash efficiency against resilience buffers |
| Lead time (standard configuration) | 4–12 weeks (high variability by complexity) | Competitive differentiation lever and credibility signal |
| Preventive maintenance compliance | 80%–95% | Reduces unplanned downtime risk and stabilizes throughput |
5. Competitor and Market Landscape
French manufacturing is not one arena. It’s a bundle of arenas stacked on top of each other: aerospace systems, automotive, chemicals and materials, industrial equipment, electrical and automation, plus thousands of SMEs and ETIs that quietly keep the supply chain alive. So instead of pretending there’s a single “market share leaderboard,” this section maps the landscape in a way that’s actually usable: who matters by segment, where disruptors are showing up, and how strategies differ in positioning, pricing, and business model.Top players and where they dominate
France’s manufacturing “gravity wells” sit in a few clusters where the country has either (a) deep technical barriers, (b) a large installed base, or (c) global export strength.| Segment | France-anchored leaders (examples) | Why they matter in the ecosystem |
|---|---|---|
| Aerospace and aerospace systems | Airbus, Safran (plus dense Tier-1/Tier-2 base) | High certification barriers, long programs, sticky supplier relationships. Airbus has been moving to secure industrial capacity via acquisition of Spirit AeroSystems sites. Source |
| Energy management, electrification, automation | Schneider Electric, Legrand (plus automation and instrumentation specialists) | Exposure to structural electrification and industrial digitization trends; recurring service and software mix can be a differentiator. Schneider’s acquisition of Motivair reflects focus on thermal management and infrastructure. Source |
| Materials and specialty chemicals | Saint-Gobain, Arkema (plus specialty materials network) | Materials are cost-sensitive and regulated, but can hold pricing power in specialty niches; large influence on construction and industrial inputs. |
| Automotive and mobility manufacturing | Renault, Stellantis footprint (plus Valeo and suppliers) | High volume, high pressure. The sector faces transition risk and production uncertainty; expectations of an 11% drop in Stellantis car production in France between 2025 and 2028 were reported (based on union estimates). Source |
| Rail and industrial transport | Alstom (plus component ecosystem) | Long-cycle projects; heavy regulatory and procurement complexity; strong export exposure. |
Emerging startups and disruptors
The disruptors in French manufacturing generally fall into three buckets:- Industrial decarbonization and reindustrialization deeptech Bpifrance and France Industrie published a mapping focused on deeptech startups working on decarbonization and reindustrialization, signaling that this is a prioritized innovation pipeline. https://presse.bpifrance.fr/bpifrance-et-france-industrie-presentent-la-premiere-edition-du-mapping-des-startups-deeptech-engagees-pour-la-decarbonation-et-la-reindustrialisation
- Manufacturing tech and productivity tooling Platforms and vendors in MES-lite, quality analytics, predictive maintenance, and industrial data layers keep showing up because plants want ROI fast without ripping out core ERP. A directory-style view of France-based manufacturing tech companies in late 2025 illustrates breadth, even if it is not a definitive ranking. https://www.f6s.com/companies/manufacturing-tech/france/co
- “Physical” green-industry scaleups Battery value chain, sustainable materials, recycling, and industrial heat decarbonization are pulling investment because policy and procurement pressures align.
Strategic differences in positioning, pricing, and business model
The biggest strategic split in French manufacturing is not “premium vs low-cost.” It’s “product-first vs lifecycle-first.”| Archetype | Positioning style | Pricing style | Business model move that wins |
|---|---|---|---|
| Complex systems leaders (aerospace, rail) | Reliability, certification, program execution | Long-term contracts, negotiated pricing, change orders | Lock in backlog, protect quality, secure supply chain. Airbus acquisition of Spirit sites is a classic resilience move. Source |
| Automation and electrification leaders | Efficiency, energy savings, digital enablement | Value-based bundles, service contracts | Grow installed base revenue and software attachment; capability buys like Motivair support the stack. Source |
| Materials and chemicals | Performance, compliance, reliability of supply | Mix of formula pricing and negotiated contracts | Defend margins through specialty mix and supply reliability; manage regulatory and energy exposure. |
| Auto-related manufacturing | Cost, scale, supply continuity | Aggressive OEM-driven pricing pressure | Survive by repositioning (EV transition) and operational efficiency; production risk remains a headline issue. Source |
| Industrial SMEs and ETIs | Responsiveness, customization, local trust | Relationship pricing, project-based | Win by speed, flexibility, and niche specialization, but they are most exposed to cost volatility and demand dips. |
Competitive Matrix
| Category | Low reach (regional) | Medium reach (EU) | High reach (global) |
|---|---|---|---|
| High product complexity (certified systems, mission critical) | Niche aerospace machining specialists; certified component makers | Tier-2 / Tier-1 subsystem suppliers | Airbus, Safran and global system integrators |
| Medium product complexity (industrial equipment, automation components) | Local machine builders; retrofit specialists | Mid-market automation vendors | Schneider Electric and global electrification players |
| Lower product complexity (commoditized components, basic fabrication) | Job shops; standard fabrication | Contract manufacturers | Scale players competing hard on cost and delivery |
SWOT-Style Summary of Top 5 Players
| Archetype | Strengths | Weaknesses | Opportunities | Threats |
|---|---|---|---|---|
| Global Aerospace Prime / Integrator | Large backlog, high technical barriers, strong supply chain leverage | Slow program cycles, heavy compliance burden | Vertical integration, supplier consolidation, long-term defense demand | Bottlenecks, geopolitical supply risk, program delays |
| Aerospace Systems Supplier | Sticky integration, certification moat, aftermarket potential | Customer concentration risk, pricing pressure from OEMs | Capability acquisitions, expanded services and lifecycle revenue | Quality escapes, OEM renegotiation pressure |
| Electrification & Industrial Automation Platform | Installed base scale, recurring service revenue, energy transition tailwinds | Portfolio complexity, integration challenges | Data center growth, industrial efficiency demand, software attachment | Commoditization at low end, global competition |
| Automotive Manufacturing & Supplier Ecosystem | Scale, industrial footprint, platform manufacturing expertise | Margin pressure, EV transition disruption | Electrification components, circularity, battery ecosystem growth | Production declines, demand volatility, OEM pricing pressure |
| Deeptech Decarbonization & Reindustrialization Startup | Innovation leverage, policy alignment, high growth potential | Scale-up risk, capital intensity, long industrial sales cycles | Public funding support, industrial partnerships, pilot-to-scale expansion | Time-to-industrialize risk, procurement friction, funding cyclicality |
6. Trend Analysis and Forward Outlook
This is the section where the sector stops being “a set of factories” and becomes what it really is: a system that reacts to interest rates, regulation, energy economics, and tech shocks. Sometimes slowly. Sometimes all at once.Macroeconomic factors: rates, inflation, demand
Rates are no longer a rounding error Financing costs are materially higher than the pre-2022 era, even after the euro area’s easing cycle.- The ECB deposit facility rate has been 2.00% since June 11, 2025. (European Central Bank)
- Capex hurdle rates rise, which favors projects with faster payback or heavy public co-financing.
- Buyers push harder on payment terms and inventory commitments.
- M&A still happens, but “strategic fit” beats “cheap leverage” as the main story.
- It takes some pressure off wage negotiations and input prices.
- But it doesn’t automatically restore demand. Manufacturers can still be stuck with a utilization problem if order books don’t follow.
- In January 2026, Insee’s manufacturing business climate indicator rose to 105, described as its highest level since July 2022. (Insee)
- Banque de France’s monthly business survey (published January 13, 2026) reported activity continued to grow in December, with strong growth in industry driven by aeronautics and defence-related sectors. (Banque de France)
- S&P Global’s HCOB France Manufacturing PMI release for January 2026 describes output rising at the strongest rate in nearly four years, even while new orders were still shrinking. That “output up, orders soft” combo often signals restocking and backlog work rather than a clean demand breakout. (pmi.spglobal.com)
Regulation and industrial policy: the rulebook is now a competitive lever
CBAM begins its definitive regime in 2026 If you import carbon-intensive goods into the EU (steel, aluminium, cement, fertilisers, electricity, hydrogen), 2026 is the “real” start of CBAM, not the rehearsal.- The European Commission states the CBAM definitive period starts January 1, 2026, after a transitional phase (2023–2025). (Taxation and Customs Union)
- More pressure on traceability and emissions data from suppliers.
- Procurement gets more careful about embedded-carbon exposure.
- Materials-heavy sectors (metals, cement, chemicals) feel this fastest.
- More policy attention on industrial energy pricing, long-term clean power contracts, and accelerated permitting.
- More grant/aid frameworks tied to decarbonisation and resilience rather than “growth for growth’s sake.”
- McKinsey’s 2025 State of AI notes broader use (including more agentic AI), but also that many organizations still struggle to embed AI deeply enough to realize material enterprise-level benefits. (McKinsey & Company)
- Automation hardware
- Sensors and data capture
- Vision systems for quality Deloitte’s 2025 smart manufacturing survey highlights these as common priorities over the next 24 months (global survey). (Deloitte)
- Quality: computer vision moves from “cool demo” to “we caught defects we used to ship.”
- Maintenance: predictive signals get tied to CMMS workflows (not just dashboards people ignore).
- Planning: APS and scheduling tools get rebuilt around constraint-based reality, because demand is too uneven for fantasy forecasts.
Consumer sentiment trends: the quiet driver in the background
Even for industrial manufacturing, consumer sentiment leaks into demand through autos, housing/construction, and durable goods. What matters less is “are consumers happy” and more is “are downstream industries confident enough to order.” In early 2026, the signals are mixed:- Manufacturing sentiment improved (Insee)
- Some downstream demand remains cautious (PMI: new orders still contracting) (pmi.spglobal.com)
Predicted strategic moves in finance, marketing, ops
Finance
- More portfolio shaping: divest non-core, buy capabilities that reduce dependency (especially in aerospace and energy infrastructure).
- Greater appetite for deals that secure capacity, service networks, or critical subsystems rather than pure revenue roll-ups.
- Blended financing becomes normal: public co-financing plus private capital, especially for decarbonisation capex.
Marketing
- Buyer self-serve accelerates. Teams invest in technical content, configurators, and proof assets because buyers want to shortlist before talking to sales (see Gartner’s rep-free preference statistic from Section 3, and omnichannel expectations). (pmi.spglobal.com, Banque de France)
- ABM becomes more practical and less “brand theater”: fewer target accounts, deeper technical enablement.
Operations
- Resilience gets engineered, not just discussed: dual-sourcing, inventory segmentation, and supplier emissions data collection (pushed by CBAM and customer requirements). (Taxation and Customs Union)
- AI focus shifts from experimentation to a few high-payoff use cases (quality, maintenance, scheduling). (McKinsey & Company, Deloitte)
Trend Timeline (Last 3 Years + Projections)
Forecasted Spend per Channel/Function
| Function | Spend direction (12–24 months) | Why it moves | What “good” looks like |
|---|---|---|---|
| Finance (capex, M&A integration) | Up for decarbonisation and resilience capex; flat to down for non-core expansion | Rates still matter, but policy support and supply chain risk justify targeted investment | Phased capex, blended financing, integration discipline |
| Marketing: technical content + website experience | Up | Buyers self-educate; technical validation happens earlier; less tolerance for vague claims | Spec-first pages, configurators, proof assets, fast RFQ pathways |
| Marketing: paid media | Flat to slightly up, but more selective | Used for high-intent capture, not broad awareness | Tight targeting, strong landing pages, closed-loop attribution to pipeline |
| Sales enablement | Up | Long, technical sales cycles need better tools and proof | Libraries of case studies, ROI calculators, sector-specific playbooks |
| Operations: automation + sensors | Up | ROI is clearer; factories prioritize throughput stability and quality | OEE-linked automation projects; measurable scrap and downtime reductions |
| Operations: AI (quality, maintenance, planning) | Up from a small base | Companies push past pilots into a few high-payoff deployments | Embedded in workflows (CMMS/MES), not stand-alone dashboards |
| Compliance and carbon data systems | Up | CBAM and customer requirements push traceability | Supplier emissions data pipelines, audit-ready reporting |
7. Strategic Recommendations
This is the part teams actually copy into a deck and argue about (in a good way). The point is not “do more.” It’s “do fewer things, better, with measurable impact.” Below are cross-functional plays that fit French manufacturing’s 2026 reality: demand uncertainty, higher hurdle rates, tighter talent markets than pre-Covid, and rising compliance pressure. None of this is investment advice.Strategy Playbook Grid
| Function | Recommendation | Why it’s worth doing now | Expected impact | What to measure (so it’s not vibes) |
|---|---|---|---|---|
| Finance | Treat public co-financing as a core financing layer, not a bonus | France’s industrial funding stack is unusually supportive; ignoring it raises your cost of capital and slows projects | Faster capex execution, improved funding terms, better downside protection | % of eligible projects funded; time-to-funding; capex ROI vs plan |
| Finance | Shift KPI focus from pure EBITDA to cash conversion and utilization resilience | When capacity expands faster than demand, “profit on paper” can hide working capital pain | Stronger runway and operational flexibility | Cash conversion cycle; inventory turns; utilization; OTIF |
| Finance | Build an M&A filter that prioritizes capability and bottleneck removal | The best deals right now de-risk supply chains and expand high-barrier subsystems | Higher pricing power, improved delivery reliability | Post-merger OTIF; margin by product line; synergy realization timeline |
| Marketing | Rebuild the website as a self-serve sales engineer | Buyers increasingly want rep-free evaluation; your site must carry technical credibility | Lower CAC, shorter sales cycle, higher conversion to qualified RFQs | Spec-download rate; quote-start rate; time-to-first-response; win rate by entry channel |
| Marketing | Make proof the hero: quantified case studies, validation packs, certifications, lead times | Manufacturing buyers are allergic to vague claims; specific proof reduces perceived risk | Faster shortlisting, less deal friction | Sales cycle length; stage conversion; “proof asset” influence on pipeline |
| Marketing | Tighten paid spend to high-intent capture and retargeting | Paid can work well in industrial, but only when tied to intent and strong landing pages | Lower wasted spend, better pipeline quality | Cost per qualified RFQ; landing-page conversion; assisted revenue |
| Marketing + Sales | Implement account-based follow-up discipline for events | Events can be gold, but only with ruthless follow-up processes | Higher ROI on trade show budgets | Cost per SQL meeting; follow-up SLA compliance; meeting-to-opportunity rate |
| Operations | Build a corridor playbook for logistics and landed-cost stability | Throughput can improve while costs stay volatile; contracts need realism | Fewer delivery surprises, improved margin protection | Freight cost variance; OTIF; lead time accuracy vs promise |
| Operations | Upgrade from “data collection” to “workflow automation” in maintenance and quality | Dashboards don’t change outcomes; CMMS/MES-integrated actions do | Reduced downtime, scrap, and firefighting | OEE; PM compliance; scrap rate; mean time to repair (MTTR) |
| Operations | Make energy a first-class operational KPI and site decision input | Energy stability is now strategic for decarbonization and competitiveness | Lower volatility, better long-term plant economics | Energy cost per unit; volatility; emissions per unit; downtime tied to energy constraints |
| Ops + Compliance | Stand up a supplier carbon and traceability pipeline | Carbon reporting and border mechanisms push traceability into procurement | Lower compliance risk, smoother customer audits | % suppliers with verified data; audit cycle time; exceptions per month |
| People | Treat apprenticeships and internal mobility as a production system | Hiring eased versus peak years, but skill depth is still scarce | Higher retention, stronger bench, less overtime churn | Time-to-competency; retention; internal fill rate; safety incidents |
A few quick “what good looks like” playbooks
- The self-serve proof funnel (marketing + sales)
- One page per use case, not one page per product category.
- Each page includes: operating envelope, certifications, standard lead times, install requirements, and a “common failure modes” section.
- RFQ path is short: 6–10 fields max.
- Sales response SLA is visible and enforced.
- The utilization defense plan (finance + ops) When demand is uneven, the best operators pre-decide how they’ll protect utilization and cash:
- Segment products: high-margin/low-volume vs low-margin/high-volume.
- Set triggers: if backlog falls below X weeks, activate specific levers (shift patterns, maintenance windows, sales pushes on service/aftermarket, selective promotions).
- Tie incentives to OTIF and cash conversion, not just output.
- The “pilot escape” AI rule (ops) AI projects die in two ways: they stay pilots forever, or they get scaled without integration and become expensive noise.
- Only fund AI/analytics projects that can be embedded into an existing workflow (CMMS, MES, QMS, planning).
- Require a hard metric: scrap reduction, MTTR reduction, OEE lift, or lead-time accuracy.
- Kill or scale within 90–180 days based on evidence.
8. Appendices and Sources
Raw Data Tables
Appendix A.1 — Manufacturing share of GDP (France)
| Metric | Year | Value | Unit | Source |
|---|---|---|---|---|
| Manufacturing value added | 2024 | 9.43 | Percent of GDP | World Bank |
Appendix A.2 — France share of EU value of sold production
| Metric | Year | Value | Unit | Source |
|---|---|---|---|---|
| France share of EU sold production | 2024 | 12 | Percent | Eurostat |
Appendix A.3 — Net industrial site openings (France — State Industrial Barometer)
| Year | Net openings | Source |
|---|---|---|
| 2022 | 176 | Baromètre industriel de l’État (March 2025 PDF) |
| 2023 | 189 | Baromètre industriel de l’État (March 2025 PDF) |
| 2024 | 89 | Baromètre industriel de l’État (March 2025 PDF) |
Appendix A.4 — Net industrial site openings by region (2024)
| Region | Net openings (2024) | Source |
|---|---|---|
| Auvergne-Rhône-Alpes | 32 | Baromètre industriel de l’État (regional map section) |
| Nouvelle-Aquitaine | 24 | |
| Occitanie | 12 | |
| Centre-Val de Loire | 9 | |
| Pays de la Loire | 8 | |
| Provence-Alpes-Côte d'Azur | 5 | |
| Bourgogne-Franche-Comté | 3 | |
| Normandie | 2 | |
| Bretagne | 0 | |
| Corse | 0 | |
| Île-de-France | -1 | |
| Hauts-de-France | -2 | |
| Grand Est | -3 |
Appendix A.5 — Industrial startup funding and industrialization financing (2024)
| Metric | Value | Unit | Source |
|---|---|---|---|
| Industrial startups tracked | 3200 | Count | Bpifrance / France Industrie Observatory |
| Industrial startup funding raised | 2.83 | Billion EUR | Bpifrance / France Industrie Observatory |
| Industrial sites inaugurated | 115 | Count | Bpifrance press release / observatory |
| Financing deployed for industrialization | 3.7 | Billion EUR | Bpifrance press release / observatory |
Appendix A.6 — Foreign investment decisions (France)
| Metric | Year | Value | Unit | Source |
|---|---|---|---|---|
| Foreign investment decisions | 2024 | 1688 | Count | Business France (2024 annual report PDF) |
| Share of production-related decisions | 2024 | 28 | Percent | Business France (2024 annual report PDF) |
Appendix A.7 — Logistics and cost signals
| Metric | Year | Value | Unit | Source |
|---|---|---|---|---|
| HAROPA container throughput | 2025 | 3.2 | Million TEU | HAROPA PORT |
| HAROPA YoY growth | 2025 | 4 | Percent | HAROPA PORT |
| Road freight non-fuel cost increase | 2024 | 5.5 | Percent YoY | CNR |
Appendix A.8 — Interest rates, inflation, and business climate
| Metric | Date / Period | Value | Unit | Source |
|---|---|---|---|---|
| ECB deposit facility rate | June 11, 2025 | 2.00 | Percent | ECB |
| France CPI inflation | January 2026 | 0.3 | Percent YoY | INSEE |
| Manufacturing business climate indicator | January 2026 | 105 | Index level | INSEE |
Appendix A.9 — Policy and regulatory context
| Policy | Event | Effective date | Source |
|---|---|---|---|
| Clean Industrial Deal | EU initiative launched | February 26, 2025 | European Commission |
| CBAM (Carbon Border Adjustment Mechanism) | Definitive regime begins (after transitional phase) | January 1, 2026 | European Commission |
| Net-Zero Industry Act | EU clean-tech manufacturing capacity objective | 2030 target | European Commission |
Full source list
Macroeconomic and industrial data- World Bank – Manufacturing value added (% of GDP), France https://data.worldbank.org/indicator/NV.IND.MANF.ZS?locations=FR
- Eurostat – Industrial production statistics https://ec.europa.eu/eurostat/statistics-explained/index.php/Industrial_production_statistics
- INSEE – Business climate indicator and CPI releases https://www.insee.fr/en/statistiques/2405582 https://www.insee.fr/en/statistiques/8734318
- Banque de France – Monthly business survey https://www.banque-france.fr/en/publications-and-statistics/publications/monthly-business-survey-start-january-2026
- S&P Global – France Manufacturing PMI (Jan 2026) https://www.pmi.spglobal.com/Public/Home/PressRelease/a94ad8549af940068d8643db0ad6cb28
- France 2030 overview https://www.info.gouv.fr/grand-dossier/france-2030-en/understanding-france-2030
- Bpifrance industrial observatory and press release https://analysesindustriefrance.fr/ https://presse.bpifrance.fr/bpifrance-publie-la-troisieme-edition-de-son-observatoire-annuel-des-startups-pme-et-eti-industrielles-francaises-qui-confirme-la-resilience-de-lecosysteme-industriel-avec-115-inaugurations-de-sites
- Business France – Annual foreign investment report 2024 https://en.media.businessfrance.fr/assets/pr-bilan-invest-2024-business-france-eng-final-pdf-3a77c-aba4d.html?dl=1
- Alfa Laval acquisition of Fives Cryogenics https://www.alfalaval.com/media/news/investors/2025/alfa-laval-signs-an-agreement-to-acquire-the-cryogenics-business-from-the-french-group-fives/
- Safran acquisition announcement https://www.safran-group.com/download/press_release/file/2257165
- Airbus acquisition of Spirit AeroSystems sites https://www.airbus.com/en/newsroom/press-releases/2025-12-airbus-completes-acquisition-of-spirit-aerosystems-sites
- Schneider Electric acquisition of Motivair https://www.se.com/ww/en/assets/564/document/506659/Schneider%20Electric-completes_acquisition-of-Motivair-Corporation.pdf
- Financial Times – Stellantis production discussion https://www.ft.com/content/5c12aec2-2050-4cbf-a3d0-d8196fc72bd4
- HAROPA PORT performance update https://www.haropaport.com/en/news/record-traffic-and-growing-modal-share-2025-seine-corridor
- Comité National Routier (CNR) cost update https://www.cnr.fr/conjoncture-economique-et-couts-du-transport-routier-octobre-2024
- Carbon Border Adjustment Mechanism (CBAM) https://taxation-customs.ec.europa.eu/carbon-border-adjustment-mechanism_en
- Clean Industrial Deal https://commission.europa.eu/topics/competitiveness/clean-industrial-deal_en
- Net-Zero Industry Act https://commission.europa.eu/topics/competitiveness/green-deal-industrial-plan/net-zero-industry-act_en
Data limitations and methodological notes
- Sector aggregation “French manufacturing” spans aerospace, chemicals, automotive, machinery, food processing, and more. Aggregated metrics (like margins or multiples) mask substantial subsector variance.
- Multiples and valuation ranges EV/Revenue and EV/EBITDA ranges provided are representative of public market bands across European industrial archetypes, not tied to a single valuation date or recommendation.
- Survey-based insights Buyer preference and AI adoption insights are survey-based (e.g., Gartner, McKinsey, Deloitte). These reflect respondent samples, not census data.
- Policy interpretation Policy documents (Clean Industrial Deal, CBAM, Net-Zero Industry Act) describe frameworks and targets. Actual implementation and impact vary by member state and company exposure.
- Timing Data points reflect the latest publicly available information cited in each source as of early 2026. Manufacturing cycles move quickly; verify critical figures before making financial or operational decisions.