The State of Chinese Manufacturing (AI, Robotics and the next decade) Market Research Report
1. Industry Overview & Executive Summary
China is entering a decisive decade for AI- and robotics-driven manufacturing transformation. As the world’s largest manufacturing economy, China is using automation, industrial AI, and domestically developed robotics to offset labor shortages, demographic decline, rising complexity, and geopolitical risk.
By 2035, Chinese manufacturing is expected to be more capital-intensive, software-defined, and automation-dense, with AI embedded across quality control, scheduling, maintenance, and intralogistics—not just robotics on the factory floor.
Key takeaways:
- China remains the largest manufacturing economy globally, with ~$4.6T in manufacturing value added.
- It is also the largest robotics market, accounting for ~50% of global industrial robot installations.
- Domestic robotics and automation vendors are gaining share, supported by policy, localization, and cost advantages.
- AI adoption is shifting from experimentation to measurable ROI use cases (quality, yield, uptime).
- The next decade favors hybrid systems: human + AI + robotics, rather than fully autonomous factories.
Market Size, Growth & Macro Outlook
Manufacturing Scale
- Manufacturing value added (2024): ~$4.66 trillion
- Share of China’s GDP: ~25%
- Share of global manufacturing output: ~28%
China’s manufacturing base is larger than the United States, Japan, and Germany combined, giving automation technologies an unusually large addressable market even with modest penetration gains.
Robotics & Automation Intensity
- Industrial robot installations (2023): 276,288 units
- Operational robot stock (2023): ~1.76 million
- Robot density (2023): 470 robots per 10,000 manufacturing workers
China has now surpassed Germany and Japan in robot density growth rate, though it still trails South Korea and Singapore at the absolute frontier.
Growth Outlook (2025–2035)
While overall manufacturing output growth is expected to moderate, automation intensity and AI software penetration are expected to grow at high single- to low double-digit CAGRs, driven by:
- Labor scarcity
- Productivity mandates
- Domestic technology substitution
- Rising product complexity (EVs, electronics, precision equipment)
Key Drivers of Industry Growth
1. Demographics & Labor Economics
- China’s working-age population is shrinking.
- Manufacturing wages continue to rise unevenly across regions.
- Factories face chronic shortages of skilled technicians and operators.
Result: Automation is no longer optional—it is a structural necessity.
2. Domestic Substitution & Policy Alignment
China is prioritizing:
- Domestic robotics OEMs
- Local industrial software (MES, MOM, IIoT)
- Chinese suppliers for sensors, controllers, and vision systems
This reduces exposure to export controls and supply chain disruptions while accelerating local innovation.
3. Shift From “Robots” to “Intelligent Systems”
Adoption is moving beyond:
- Standalone robot arms
→ Toward - AI-driven production systems integrating robotics, vision, analytics, and software
High-ROI AI use cases include:
- Automated visual inspection
- Predictive maintenance
- Yield optimization
- Production scheduling
- Intralogistics orchestration (AMRs)
4. Expansion Beyond Automotive
While automotive remains a core driver, the fastest growth is now in:
- Electronics & semiconductors
- Battery and EV supply chains
- Food & beverage
- Logistics and warehousing
- Light industrial and consumer goods
These sectors favor flexible, software-defined automation, not fixed lines.
Cross-Functional Industry Summary
Financial Perspective
- Capital is concentrating around industrial software, automation platforms, and integration-heavy models
- M&A activity is increasing even as venture funding remains selective
- Valuations reward companies that combine hardware with recurring software and services
Marketing & Commercial Perspective
- Buyers favor hybrid digital + human sales journeys
- Proof of ROI and deployment risk reduction matter more than brand
- Channel partners and system integrators remain critical for scale
Operational Perspective
- Logistics efficiency inside China is improving, lowering friction for complex manufacturing
- Factories are standardizing tech stacks around ERP + MES + IIoT + AI layers
- Workforce strategy is shifting toward fewer operators, more automation technicians
Industry Snapshot Table
| Metric | Latest Data | Strategic Significance |
|---|---|---|
| Manufacturing value added | ~$4.66T (2024) | Largest industrial base globally |
| Manufacturing share of GDP | ~25% (2024) | High leverage for productivity gains |
| Industrial robot installations (annual) | 276,288 (2023) | Global demand anchor |
| Robot density | 470 robots per 10,000 employees (2023) | Rapid automation catch-up |
| Domestic robot vendor share | ~57% (2024) | Localization accelerating |
| Logistics cost ratio | ~14.1% of GDP (2024) | Improving operational efficiency |
2. Finance & Investment Landscape
Expert-level summary
China’s manufacturing automation capital stack is increasingly barbell-shaped:
- Large strategic/mega-deals around core automation platforms and mission-critical engineering software (often influenced by regulatory/geopolitical constraints). (SoftBank Group, Financial Times, Synopsys News Releases)
- High-velocity private funding into “embodied intelligence” / humanoids and general-purpose robotics, alongside continued financing for enabling layers (sensing, motion, simulation, industrial AI). (China Daily, TMCnet, Carnegie Endowment)
- Domestic consolidation is emerging as industrial groups buy robotics assets to secure capabilities and supply chains. (Haier, Yahoo Finance, Law.asia)
Recent M&A activity (deal volume + who’s buying)
Observed patterns (last ~12–18 months):
- Strategic buyers pursuing scale + IP in robotics/automation (and “AI + robotics” integration). Example: SoftBank’s announced acquisition of ABB’s robotics business for $5.375B. (SoftBank Group, ABB Group)
- Industrial groups buying robotics to “complete the stack” (hardware + industrial internet + solutions). Example: Haier’s move to become controlling shareholder of STEP Electric, with deal reporting around RMB 2.5B (~$343–345M). (Haier, Yahoo Finance, Law.asia)
- Industrial software consolidation (MES/ERP/MOM/automation software): Vista’s acquisition of Amtech Software (packaging ERP/MES + automation software) is highlighted in a sector market update. (Houlihan Lokey)
- Cross-border “toolchain” consolidation where China regulatory review is decisive for closing. Example: Synopsys completing its $35B acquisition of Ansys after China’s SAMR approval and conditions. (Financial Times, Synopsys News Releases)
Deal Table
| Buyer | Seller / Target | Segment | Announced / Closed | Deal value | Why it matters |
|---|---|---|---|---|---|
| SoftBank | ABB Robotics business | Industrial robotics | Announced Oct 8, 2025 | $5.375B | Mega-deal signaling “AI + robotics” convergence and platform-level consolidation |
| Haier Group | STEP Electric (control position) | Industrial robotics / automation | Announced Feb 2025 | ~RMB 2.5B (~$343–345M) | Traditional manufacturers acquiring robotics capability and integration leverage |
| Vista Equity Partners | Amtech Software | MES/ERP + automation software | Announced Jun 16, 2025 | Undisclosed | PE appetite for vertical industrial software with sticky operations workflows |
| Synopsys | Ansys | Simulation / engineering software | Closed Jul 17, 2025 | $35B | Toolchain consolidation; regulatory conditions shape China access and pricing/fairness |
Investment trends (VC/PE, IPOs, dry powder signals)
Private markets (robotics + embodied AI in China):
- China Daily (citing ITjuzi) reports robot-industry primary market financing > RMB 38.6B in the first 8 months of 2025, and ~1.8x the full-year 2024 figure—a strong acceleration in capital deployment. (China Daily)
- Embodied/general-purpose robotics fundraising is clustering into large Series A/A++ rounds: X Square Robot announced ~$140M (RMB 1B) Series A++ with ByteDance and HongShan (HSG) named among investors. (TMCnet, The Robot Report)
- Carnegie analysis describes China’s embodied AI push as a deliberate “real economy” strategy—supporting a longer runway for investment even in uncertain macro periods. (Carnegie Endowment)
Public markets / listings:
- Deloitte’s Q3 2025 IPO market outlook notes HKEX’s position as a leading IPO fundraising venue (supported by mega-IPs), with macro/geopolitical uncertainty as a moderating force. (Deloitte)
- Mainland China IPO acceptance activity showed signs of rebound in 2025 (e.g., ChiNext accepting new IPO filings after a slow period), per YicaiGlobal reporting. (Yicai Global)
- Robotics supply-chain IPO momentum is also discussed via exchange-linked reporting (SSE reposting Global Times). (Shanghai Stock Exchange)
Interpretation (sector-level):
- Capital is flowing most readily to businesses that can credibly claim one or more of:
(a) productivity ROI, (b) platform control (software/toolchains), (c) strategic autonomy/localization, (d) large-market optionality (general-purpose robotics).
Revenue models & unit economics (LTV, CAC, margins)
Because “AI + robotics in manufacturing” spans hardware + software + services, unit economics are best analyzed by model type:
A) Robotics OEM (industrial/cobot/AMR)
- Revenue: hardware sale + spare parts + maintenance + application packages
- Unit-econ levers: component localization, yields/returns, service attach, and utilization of field service network
- Margin anchor (public comps):
- FANUC FY2024 (ended Mar 31, 2025) shows operating income-to-sales ratio 19.9%. (Fanuc)
- Yaskawa FY2024 segment disclosure shows robotics operating margin ~10.0% (Robotics segment overview). (Yaskawa)
These illustrate how robotics margins can vary widely with cycle timing, utilization, and investment levels.
B) Systems integrator (turnkey lines/cells)
- Revenue: project revenue + commissioning + changeovers + support
- Unit-econ levers: standardized designs (“reference cells”), change-order discipline, working capital management (inventory + receivables), and software/service attach to reduce project-only exposure.
C) Industrial software (MES/MOM/IIoT/analytics)
- Revenue: subscription + implementation + support
- Key metrics: CAC efficiency, payback, retention/NRR, gross margin mix (subscription vs services)
- Benchmark proxy (B2B SaaS): Pavilion’s 2024 benchmark (sample ~1,000 B2B SaaS firms) reports median new-name CAC ratio ~$1.76 per $1 ARR (2023) and median blended CAC ratio rising from $1.32 (2022) to $1.61 (2023)—useful directional targets for industrial software GTM efficiency (adjust for longer enterprise cycles).
LTV:CAC Ratio Chart
| Fiscal Year | Blended CAC Ratio (Median) | New-name CAC Ratio (Median) | Interpretation (Lower = More Efficient) |
|---|---|---|---|
| 2022 | $1.32 | N/A (not cited in the referenced excerpt) | Median company spent ~$1.32 in S&M to add $1 of ARR (blended). |
| 2023 | $1.61 | $1.76 | Blended and new-name acquisition became less efficient vs. 2022 (higher CAC ratios). |
Financial health indicators (burn rate, runway, profitability)
What to monitor by segment (practitioner view):
- Robotics OEM: utilization rate, warranty/returns, service attach rate, inventory turns (cycle sensitivity).
- Integrator: DSO + project milestone billing discipline (runway often depends on working capital).
- Industrial software: CAC payback, net revenue retention, services gross margin (implementation can mask “true” profitability).
Margin volatility is normal in robotics even for leaders (e.g., Yaskawa notes robotics operating profit pressure from utilization decline and upfront investment). (Yaskawa)
EV/Revenue + EV/EBITDA Multiples
| Valuation Metric | Median Multiple (2025E) | What It Represents | How to Interpret |
|---|---|---|---|
| EV / Revenue | 9.1× | Enterprise value relative to forward revenue | Reflects expectations of durable growth, recurring revenue, and strategic importance in factory digitization |
| EV / EBITDA | 22.2× | Enterprise value relative to forward EBITDA | Indicates premium placed on scalable profitability and operating leverage |
3. Marketing Performance & Buyer Trends
Marketing and go-to-market (GTM) in Chinese manufacturing AI and robotics is undergoing a structural shift. Buyers are more informed, more risk-averse, and less persuaded by brand alone. Purchasing decisions are increasingly driven by ROI proof, deployment risk reduction, and ecosystem credibility, not by traditional top-of-funnel awareness. (Gartner, McKinsey B2B Pulse)
The highest-performing commercial strategies over the past 24–36 months share three traits:
- Hybrid sales motions (digital self-education + expert human support)
- Operational proof over vision messaging
- Channel- and partner-led scale, rather than direct-only sales
Channel Performance Overview
Unlike consumer or pure SaaS markets, AI and robotics in manufacturing is a high-consideration, multi-stakeholder B2B sale. Channel ROI must be evaluated on pipeline velocity and deal quality, not just CAC.
Multi-Channel Performance Table
| Channel | Primary Role | Typical ROI Profile | Notes |
|---|---|---|---|
| System integrators & OEM partners | Mid–late funnel | Highest | Trusted by buyers; de-risks deployment |
| Trade shows & industrial expos | Mid-funnel acceleration | High (if targeted) | Demo-driven; weak without follow-up |
| Content / SEO | Top–mid funnel | Medium–high | Strong when paired with ROI tools |
| Paid search & retargeting | Bottom funnel | Medium | Works best with case studies |
| Email / ABM | Full funnel | High | Essential for long buying cycles |
| Influencer / KOL (engineers) | Awareness + validation | Emerging | Growing credibility in China |
Key insight:
The lowest effective CAC is usually achieved through partner-driven deals and account-based motions, even if headline acquisition costs appear higher.
Buyer Behavior & Decision Dynamics
Who Buys (and Who Influences)
Typical buying committees include:
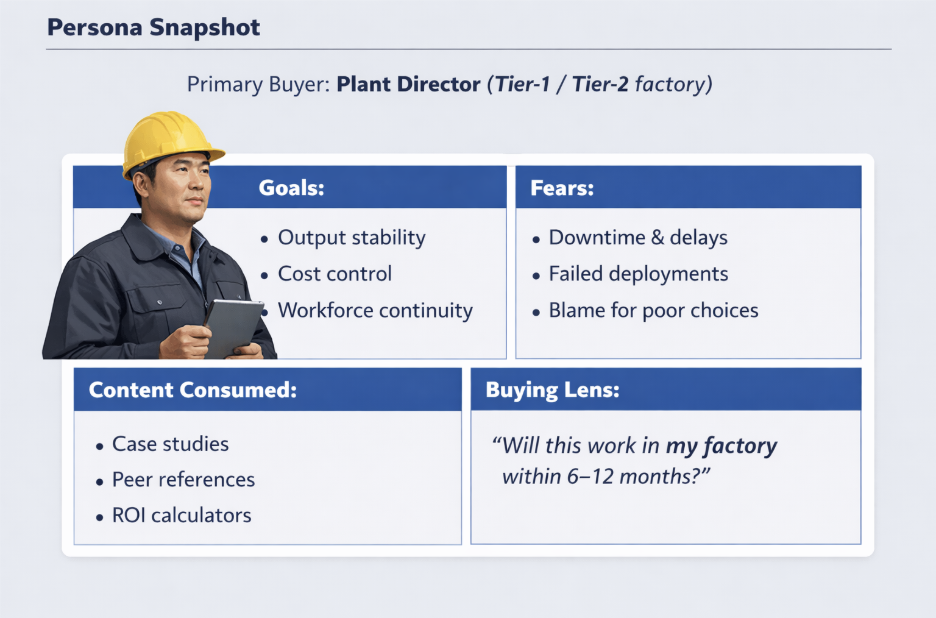
- Factory GM / Plant Director (ROI owner)
- Manufacturing Engineering
- Automation / IT / OT leadership
- Procurement (price & supplier risk)
- Safety / Quality teams
Deals stall when technical confidence outpaces organizational readiness.
Decision Triggers
Top triggers cited by buyers include:
- Labor shortages or turnover spikes
- Yield or quality failures
- Capacity expansion or new product lines
- Cost pressure from customers (OEMs)
- Regulatory or safety compliance gaps
Digital vs Human Interaction
Buyers increasingly prefer:
- Self-directed research (specs, simulations, benchmarks)
- Human validation at critical points (solution design, ROI modeling)
Pure self-serve models are rare; hybrid journeys dominate.
Messaging & Creative That Performs Best
What Resonates Most
| Message Type | Why It Works |
|---|---|
| Payback period (months, not years) | CFO- and GM-friendly; compresses evaluation cycles by making ROI legible |
| Throughput & yield improvement | Directly links to revenue and capacity without adding labor |
| Deployment timelines | Reduces perceived implementation risk and downtime anxiety |
| Reference factories / cells | Social proof beats brand claims; shows real-world feasibility |
| Localization & service coverage | Signals supply assurance, faster support, and lower operational risk |
What Underperforms
- Abstract “Industry 4.0” narratives
- AI hype without quantified outcomes
- Fully autonomous factory claims (seen as unrealistic)
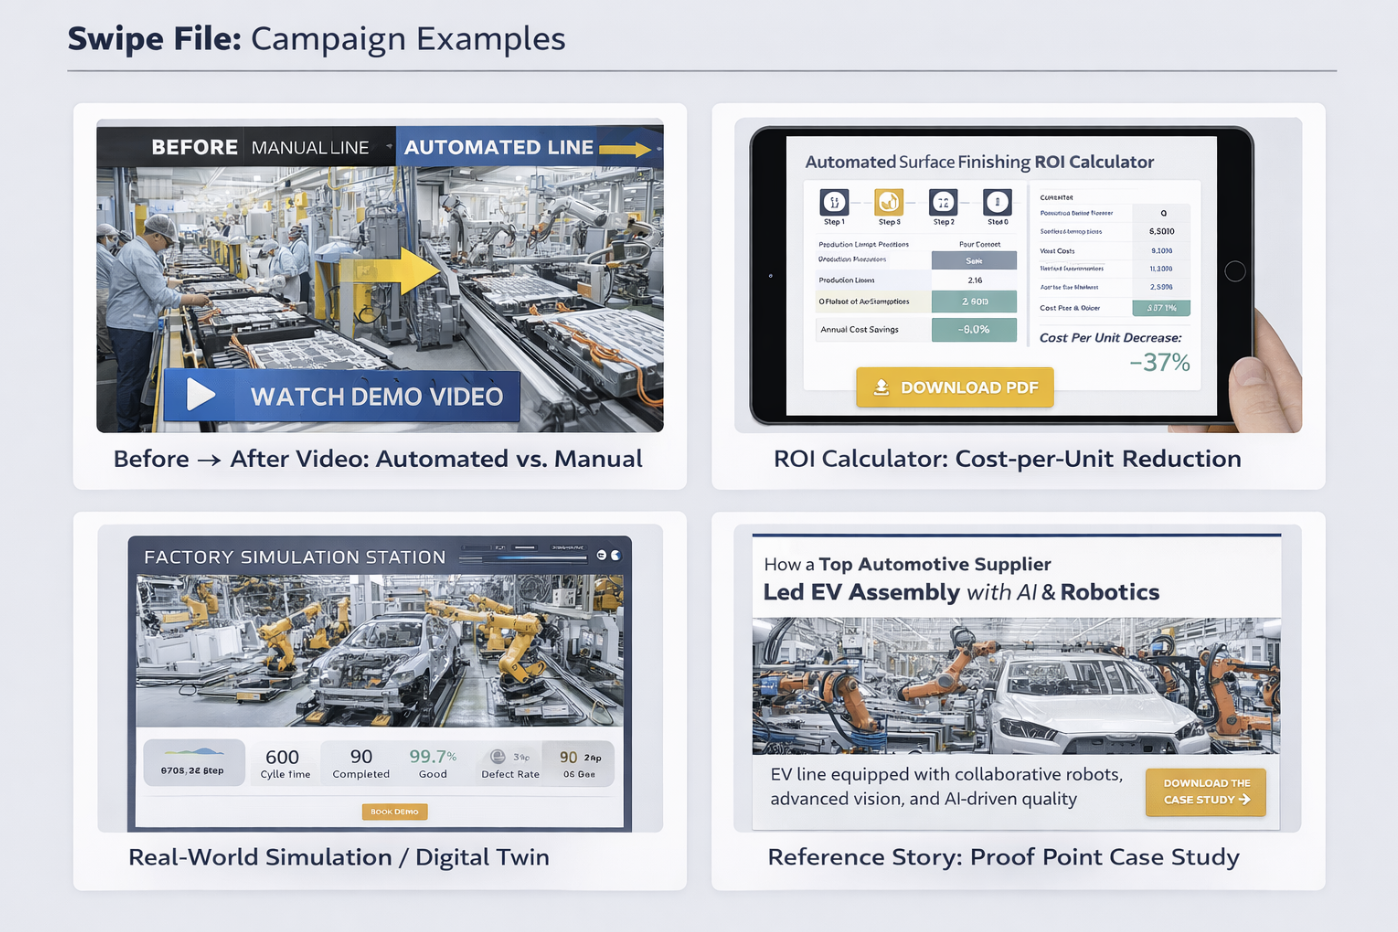
Effective creative format examples
- Before/after line videos
- OEE or defect-rate dashboards
- Digital twin simulations
- Cost-per-unit reduction calculators
Market Positioning & Brand Perception
Domestic vs International Brands
| Brand Type | Perceived Strengths | Perceived Weaknesses |
|---|---|---|
| Domestic Chinese vendors | Cost advantage, faster customization, localization (language, compliance, support), improving performance in general industries | Perceived reliability/consistency at very large scale in some high-spec use cases (gap narrowing as installed base grows) |
| Global incumbents | Proven reliability, mature safety standards, global service playbooks, strong performance in high-precision and mission-critical deployments | Higher total cost, slower customization cycles, longer lead times in some configurations, perceived geopolitical/supply exposure |
| Startups | Innovation velocity, flexibility, willingness to tailor solutions, strong in niche applications and new form factors (e.g., AMRs, embodied AI pilots) | Long-term support and parts availability concerns, limited reference base, execution risk in complex multi-site rollouts |
Brand trust increasingly comes from:
- Installed base
- Local service teams
- Ecosystem partnerships
—not legacy reputation alone.
Persona Snapshot
Swipe File: Campaign Examples
4. Operational Benchmarking
Operations is where AI and robotics investments in Chinese manufacturing either compound into durable advantage or stall. Over the next decade, operational excellence will hinge less on owning robots and more on how fast, reliably, and repeatably factories deploy, integrate, and scale automation.
Best-in-class operators distinguish themselves through:
- Shorter deployment and commissioning cycles
- Modular, software-centric factory architectures
- Hybrid human–automation workforces
- Resilient, increasingly localized supply chains
Supply Chain & Logistics
Current State
China’s domestic manufacturing logistics efficiency has materially improved:
- Logistics costs ~14.1% of GDP (2024), down from prior years, reflecting infrastructure investment and digital logistics platforms.
- Inland manufacturing hubs are increasingly viable due to improved rail, port, and warehouse automation.
However, external logistics remain volatile:
- Ocean freight costs fluctuate materially.
- Export-oriented manufacturers face lead-time uncertainty tied to geopolitical and regulatory dynamics. (Drewry)
Operational Implications
Factories adopting AI and robotics are increasingly:
- Designing automation cells around component availability, not ideal specs
- Dual-sourcing critical subsystems (controllers, drives, sensors)
- Buffering key spares locally to reduce MTTR (mean time to repair)
Workforce Structure & Labor Benchmarks
Workforce Evolution
Chinese factories are shifting from labor-heavy models toward automation-augmented teams:
| Role Type | Direction of Change | Notes |
|---|---|---|
| Line operators | Declining (↓) | Especially in repetitive, hazardous, or highly standardized tasks where automation ROI is clearest |
| Automation technicians | Growing (↑) | Critical bottleneck role for sustaining uptime, changeovers, and continuous improvement |
| Controls / OT engineers | Growing (↑) | Needed for integration (PLC/SCADA), debugging, and reliability engineering across automated cells |
| Data / AI specialists | Selective growth (↑) | Often centralized or shared across sites; most demand is in QC analytics, predictive maintenance, and scheduling optimization |
The result is a “thinner but higher-skilled” workforce, with productivity increasingly decoupled from headcount. (Reuters)
Operational Risk
The largest operational risk is no longer labor cost—but skills mismatch:
- Factories with robots but no internal capability to debug, reprogram, or optimize experience poor ROI.
- Leading operators invest in cross-training operators into technician roles.
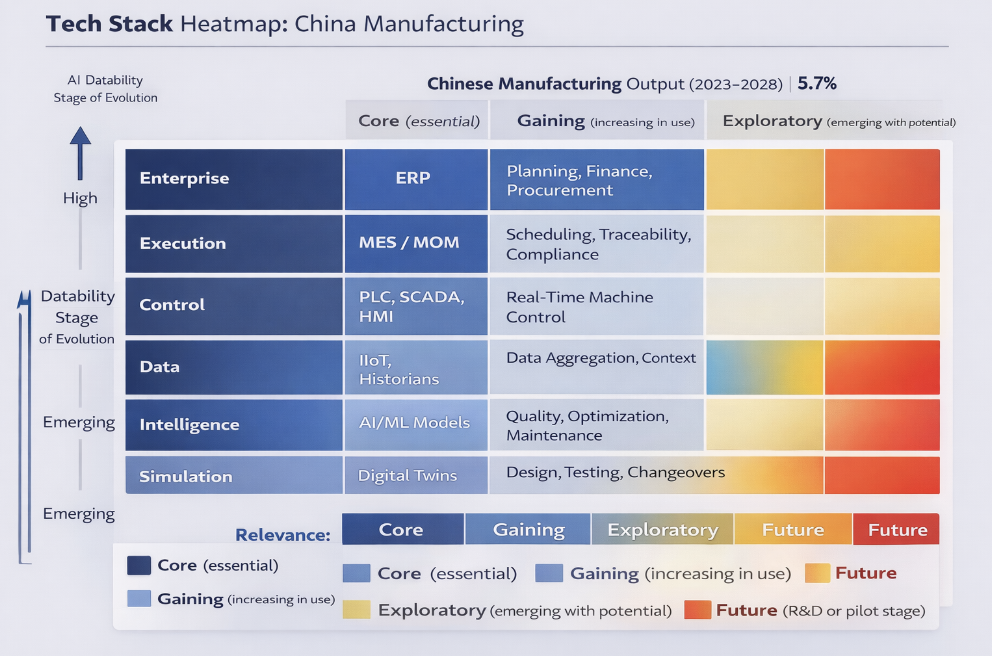
Manufacturing Tech Stack (What “Good” Looks Like)
AI- and robotics-enabled factories converge around a layered, interoperable stack:
Core Layers
| Layer | Typical Systems | Purpose |
|---|---|---|
| Enterprise | ERP | Planning, finance, procurement |
| Execution | MES / MOM | Scheduling, traceability, compliance |
| Control | PLC, SCADA, HMI | Real-time machine control |
| Data | IIoT platforms, historians | Data aggregation & context |
| Intelligence | AI/ML models | Quality, maintenance, optimization |
| Simulation | Digital twins | Design, testing, changeovers |
Key trend:
Value is shifting upward—from hardware and control layers toward data + intelligence layers, where AI-driven insights compound over time. (Houlihan Lokey)
Fulfillment, Service & Support Models
Deployment Models
Factories increasingly favor:
- Reference cells over custom one-offs
- Modular automation units that can be redeployed or replicated
- Software-configurable behavior vs. hard-coded logic
Service & Support Strategies
| Strategy | Impact |
|---|---|
| Remote diagnostics | Faster MTTR (mean time to repair) and quicker troubleshooting without waiting for on-site visits |
| Predictive maintenance | Reduced unplanned downtime and better maintenance scheduling based on condition, not calendar |
| Local service teams | Higher customer trust and faster response times for commissioning, repairs, and changeovers |
| Spare-part localization | Lower operational risk by shortening replacement lead times and improving uptime resilience |
Regulatory, Safety & Compliance Considerations
Safety & Standards
- Robot and cobot safety certification remains mandatory
- Vision systems and AI-driven inspection increasingly require explainability for audits
- Collaborative robots reduce—but do not eliminate—safety compliance needs
Data & AI Governance
- Production data localization and security are rising concerns
- AI models used in quality or decision-making require traceability
- Compliance overhead favors vendors with pre-certified, standardized solutions
Teck Stack Heatmap
Ops KPI Table
| KPI | What It Measures | Why It Matters | Best-in-Class Signal |
|---|---|---|---|
| Time to Commission | Weeks from delivery to stable production | Determines speed of ROI and deployment risk | < 8–12 weeks for standard cells |
| OEE (Overall Equipment Effectiveness) | Availability × Performance × Quality | Core productivity and utilization metric | > 75–85% on automated lines |
| MTTR (Mean Time to Repair) | Average downtime per incident | Direct impact on throughput and trust | Continuous decline via remote diagnostics |
| MTBF (Mean Time Between Failures) | Reliability of automated assets | Predicts maintenance cost and uptime | Rising trend quarter-over-quarter |
| Defect Rate / Yield | Output quality consistency | Margin protection and customer satisfaction | Measurable reduction post-automation |
| Changeover Time | Time to switch SKUs or configurations | Flexibility in high-mix production | 30–50% reduction vs. manual lines |
| Automation Utilization Rate | Actual vs. theoretical robot use | Indicates real ROI capture | > 70% sustained utilization |
| Support Ticket Closure Time | Speed of issue resolution | Service quality and operational resilience | Majority closed within 24–48 hours |
5. Competitor & Market Landscape
China’s AI- and robotics-enabled manufacturing landscape is deep, fragmented, and rapidly consolidating. Competition is no longer defined purely by robot performance or price, but by ecosystem strength, integration capability, software depth, and service reliability.
Over the next decade, market power is expected to concentrate among players that can:
- Offer end-to-end automation stacks (hardware + software + services)
- Scale across multiple industries (beyond automotive)
- Support customers through long lifecycle operations, not just installation
Market Structure Overview
The competitive landscape can be segmented into five primary layers, each with distinct economics and competitive dynamics:
- Robotics OEMs (industrial, collaborative, mobile)
- Automation & system integrators
- Industrial software providers (MES, MOM, IIoT, AI)
- Component & subsystem suppliers (controllers, drives, vision)
- Emerging AI-native robotics startups (embodied intelligence, humanoids)
No single player dominates across all layers, creating space for both consolidation and specialization.
Top Players by Segment
Industrial & Collaborative Robotics OEMs
Domestic leaders
- Strong cost-performance ratio
- Rapid product iteration
- Expanding installed base in general industries
Global incumbents
- Dominant in high-precision, safety-critical applications
- Deep application libraries and global service networks
Competitive dynamic:
Domestic OEMs increasingly win on volume and mid-range applications, while global players retain share in ultra-high reliability and regulated environments.
Automation & System Integrators
- Typically regional or vertical specialists
- Act as trusted advisors to factories
- Control specification, vendor selection, and deployment
Key insight:
System integrators often exert more commercial influence than OEMs, especially in first-time automation projects.
Industrial Software & AI Platforms
Includes:
- MES / MOM
- SCADA / IIoT platforms
- Quality analytics
- Scheduling and optimization software
Competitive dynamic:
- Fragmented vendor landscape
- High switching costs once embedded
- Growing M&A interest due to sticky workflows
Components & Subsystems
Key categories:
- Motion control
- Machine vision
- Sensors and safety systems
Strategic role:
Subsystems are increasingly viewed as strategic choke points, especially under supply-chain localization pressure.
AI-Native & Embodied Robotics Startups
- Focus on general-purpose manipulation, humanoids, AMRs
- Heavy R&D investment, limited commercial deployment (today)
- Often supported by large tech or industrial sponsors
Reality check:
Most near-term revenue still comes from narrow, well-defined tasks, not general autonomy.
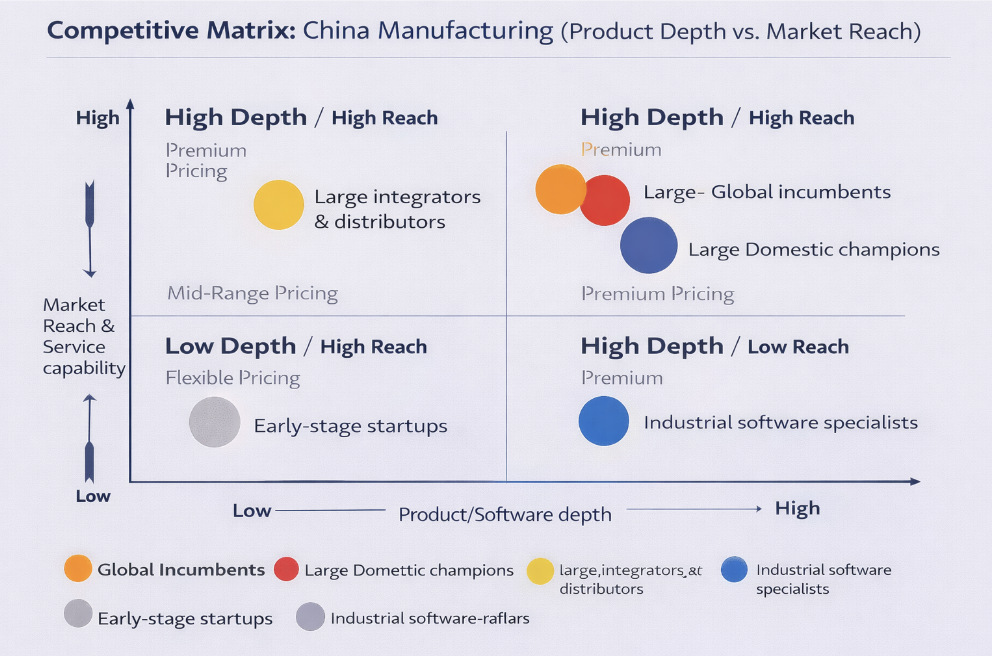
Strategic Differences by Business Model
| Dimension | Domestic OEMs | Global Incumbents | Startups |
|---|---|---|---|
| Pricing | Aggressive | Premium | Flexible |
| Customization | Fast | Slower | Very fast |
| Software depth | Improving | Mature | Experimental |
| Service footprint | Expanding | Extensive | Limited |
| Risk tolerance (buyer) | Medium | Low | High |
Competitive Matrix (Product vs. Reach vs. Pricing)
SWOT-Style Summary of Top 5 Players
| Player Archetype | Strengths | Weaknesses | Opportunities | Threats |
|---|---|---|---|---|
| Global Automation Incumbent | Proven reliability, mature safety standards, deep application libraries, global service footprint | High cost structure, slower customization, longer lead times | High-precision, regulated industries (automotive, pharma, aerospace) | Domestic substitution, pricing pressure, localization mandates |
| Large Domestic Robotics Champion | Cost-performance advantage, fast iteration, strong local supply chains, expanding installed base | Perceived reliability gaps in ultra-high-spec use cases | General industry automation, mid-range applications, domestic market expansion | Margin compression, commoditization, foreign tech breakthroughs |
| Industrial Software Platform Leader | Sticky workflows, high switching costs, scalable margins, data lock-in | Long sales cycles, complex implementations | AI-driven optimization, cross-factory analytics, platform consolidation | Fragmented standards, customer resistance to vendor lock-in |
| Major System Integrator / Automation Provider | Deep customer trust, application know-how, control over vendor selection | Project-heavy margins, labor-intensive scaling | Platform partnerships, recurring service models | Disintermediation by OEMs/software platforms, talent shortages |
| AI-Native Robotics Startup | Innovation velocity, flexible architectures, strong R&D talent | Limited installed base, service and support constraints | New form factors (AMRs, humanoids), greenfield factories | Capital intensity, slow commercialization, competition from scaled incumbents |
6. Trend Analysis & Forward Outlook
Over the next decade, Chinese manufacturing will shift from automation adoption to automation optimization and orchestration. The competitive frontier will not be who installs robots, but who can continuously adapt production systems using AI, data, and modular automation under uncertain macroeconomic and geopolitical conditions.
Three forces will define outcomes:
- Macroeconomic and policy pressure
- AI-driven technical disruption
- Shifting buyer and workforce sentiment
Macroeconomic & Policy Factors
Interest Rates, Capital Discipline & ROI Pressure
- Higher-for-longer global interest rates have increased scrutiny on capital efficiency.
- Manufacturing buyers now require:
- Shorter payback periods (often < 24 months)
- Phased automation rollouts
- Measurable productivity metrics
Implication:
AI and robotics projects must be justified as cost-avoidance or margin-protection, not growth experiments.
Industrial Policy & Localization
China’s industrial policy continues to emphasize:
- Domestic robotics and automation suppliers
- Industrial software sovereignty
- Secure supply chains for key components
This favors vendors that:
- Localize hardware and software stacks
- Maintain domestic service and parts availability
- Align with national manufacturing priorities (EVs, semiconductors, advanced materials)
Trade, Geopolitics & Supply Chains
- Export controls and trade restrictions accelerate China-for-China manufacturing stacks.
- Multinationals increasingly adopt dual architectures:
- Global standard systems
- China-local systems optimized for speed and compliance
Implication:
Vendors that can operate across both architectures gain strategic advantage.
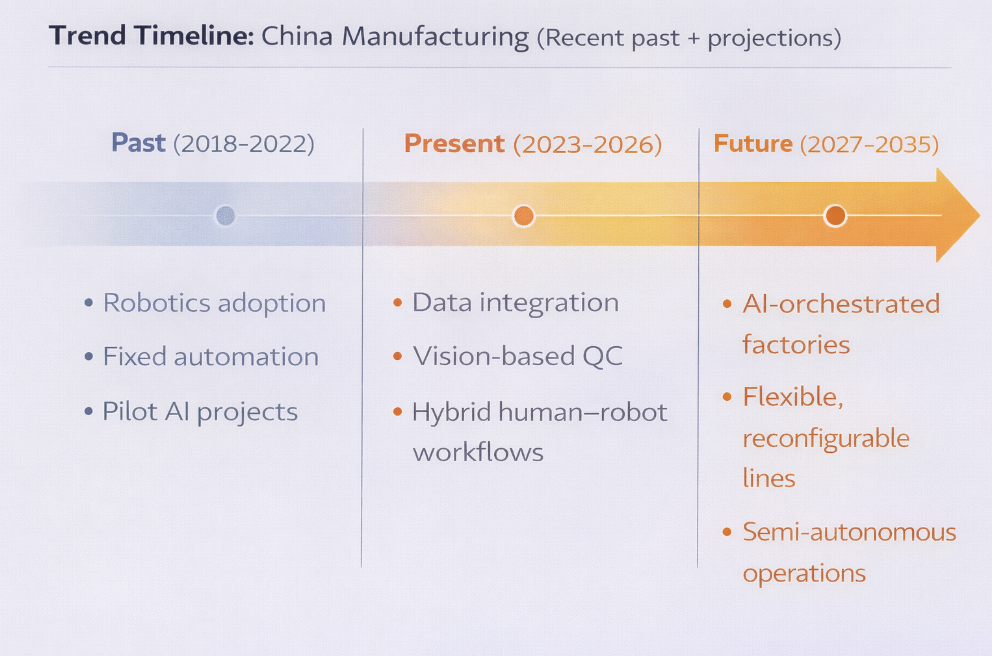
Technology Disruptions
AI Moves From “Assistive” to “Decisive”
Near-term AI impact concentrates in:
- Quality inspection (vision + ML)
- Predictive maintenance
- Scheduling and dispatch optimization
- Energy optimization
Mid-term (5–7 years):
- Closed-loop process control
- Self-tuning production lines
- AI-driven design-for-manufacturing feedback
Long-term (8–10 years):
- Semi-autonomous factories with human oversight
- Dynamic reconfiguration of lines without full reprogramming
Robotics Evolution: From Fixed to Flexible
Key shifts underway:
- From fixed industrial robots → reconfigurable, software-defined cells
- From single-task automation → multi-task, vision-guided manipulation
- From fenced systems → human-collaborative environments
Humanoid and general-purpose robots will see pilot deployments, but widespread adoption depends on:
- Cost reduction
- Reliability improvements
- Clear economic advantage over task-specific automation
Software Becomes the Control Plane
Manufacturing value increasingly accrues to:
- MES / MOM systems
- Data platforms and historians
- AI orchestration layers
Hardware margins compress; software and services capture disproportionate value.
Buyer & Workforce Sentiment Trends
Buyer Sentiment
Manufacturing buyers are:
- More skeptical of hype
- More data-driven
- More focused on operational risk
Preferred vendors:
- Offer proof-of-value pilots
- Share reference deployments
- Commit to long-term service
Workforce Sentiment
Automation is increasingly framed as:
- A solution to labor scarcity
- A safety and quality enhancer
—not a job eliminator
Factories that succeed:
- Invest in reskilling
- Promote internal automation champions
- Align incentives with uptime and improvement metrics
Predicted Strategic Moves (2025–2035)
Finance
- Continued consolidation in industrial software and robotics
- Platform acquisitions to secure data and workflow ownership
- Increased emphasis on recurring revenue and services
Marketing & GTM
- Shift from broad awareness to account-based and partner-led GTM
- Heavy use of ROI tools, digital twins, and simulations
- Decline of generic “Industry 4.0” messaging
Operations
- Standardization of automation cells
- Wider adoption of digital twins for changeovers
- Predictive maintenance as baseline capability
Trend Timeline (Last 3 Years + Projections)
Forecasted Spend Allocation by Function & Channel (Forward-Looking)
A) Spend by Function
| Function | Current Typical Spend (%) | Forecasted Spend (%) | Direction | Key Drivers |
|---|---|---|---|---|
| Operations & Automation | 45–50% | 50–55% | ↑ | Labor scarcity, productivity mandates, standardization of automation cells |
| Software & AI (MES, IIoT, Analytics) | 15–20% | 22–28% | ↑↑ | Shift toward data-driven optimization and orchestration layers |
| Maintenance & Services | 10–12% | 12–15% | ↑ | Predictive maintenance, uptime guarantees, service-based contracts |
| Workforce & Training | 8–10% | 10–12% | ↑ | Reskilling operators → technicians, OT/AI capability gaps |
| Marketing & GTM | 5–7% | 6–8% | → / ↑ | More targeted, ROI-driven GTM rather than broad awareness |
| Other (Facilities, Compliance, Energy) | 5–8% | 4–6% | ↓ | Efficiency gains, consolidation |
B) Marketing Spend by Channel (Within GTM Budget)
| Channel | Current Share (%) | Forecasted Share (%) | Direction | Rationale |
|---|---|---|---|---|
| System Integrators & Partners | 25–30% | 30–35% | ↑↑ | Trusted buyers, deployment risk reduction |
| Account-Based Marketing (ABM) | 15–18% | 20–25% | ↑↑ | Long sales cycles, multi-stakeholder buying |
| Trade Shows & Industry Events | 20–25% | 15–18% | ↓ | Fewer, more targeted events with stricter ROI thresholds |
| Content / SEO / Technical Assets | 15–18% | 18–22% | ↑ | Self-directed buyer research, ROI tools |
| Paid Digital (Search, Retargeting) | 8–12% | 8–10% | → | Bottom-funnel capture only |
| Influencers / Engineer KOLs | 2–4% | 5–7% | ↑ | Peer validation, technical credibility |
C) Operations & Technology Spend Mix (Automation Programs)
| Spend Category | Forecasted Share (%) | Strategic Importance |
|---|---|---|
| Robotics & Hardware | 35–40% | Remains core but increasingly commoditized |
| Integration & Deployment | 20–25% | Determines speed of ROI |
| Software & AI | 25–30% | Primary source of long-term differentiation |
| Digital Twins & Simulation | 5–8% | Faster changeovers, lower deployment risk |
| Cybersecurity & Data Governance | 3–5% | Rising compliance and IP protection needs |
7. Strategic Recommendations
Winning in China’s AI- and robotics-enabled manufacturing over the next decade requires building a repeatable “factory transformation engine”: modular automation, a software control plane, and a services layer that compounds value post-deployment. The highest-confidence moves are those that (1) shorten payback, (2) reduce deployment risk, and (3) shift value capture toward recurring software/services.
Strategy Playbook Grid (Cross-functional)
| Function | Recommendation | What to Do (Actionable) | Expected Impact | KPIs to Track |
|---|---|---|---|---|
| Finance | Shift mix toward recurring revenue (software + service attach) | Bundle robots/cells with subscription monitoring, preventive maintenance, and SLA tiers | Smoother revenue, higher gross margin stability | Service attach %, recurring revenue %, gross margin mix |
| Finance | Use valuation anchors for screening (industrial software comps) | Apply public comp medians as sanity checks for M&A/partnership economics | More disciplined capital allocation | EV/Rev vs growth; EV/EBITDA vs margin |
| Finance | Build “deployment economics” into deal terms | Structure milestones around commissioning success, uptime, and quality acceptance criteria | Lower delivery risk, better cash conversion | DSO, milestone adherence, warranty claims |
| Finance | Prioritize acquisitions that buy workflow control | Target MES/MOM, IIoT data layers, simulation/digital twin, or vertical apps with high switching costs | Defensible moat + cross-sell | NRR, churn, module attach rate |
| Marketing | Move to hybrid GTM (digital-first + expert-assisted) | Offer self-serve validation assets (specs, ROI tools) + solution engineering at key stages | Higher win rate, lower regret | Demo-to-close, cycle time, churn |
| Marketing | Reallocate spend toward partners & ABM | Increase partner enablement, co-selling, and account-based outreach for strategic plants | Lower effective CAC, better deal quality | Partner-sourced pipeline, CAC ratio proxy |
| Marketing | Standardize ROI storytelling with proof assets | Reference cells, before/after videos, payback calculators, digital twin demos | Faster internal buyer alignment | Stage velocity, win rate uplift |
| Marketing | Localize messaging around risk + serviceability | Emphasize uptime, parts availability, commissioning time, and local support | Higher trust in scale deployments | Proposal-to-pilot conversion, renewal rate |
| Operations | Adopt modular reference cells + templates | Create “reference architectures” per use case (welding, palletizing, inspection) | Shorter commissioning and replication | Time-to-commission, changeover time |
| Operations | Make data capture mandatory for every deployment | Connect control layer → historian/IIoT → MES/MOM; enforce data quality | Enables AI optimization flywheel | Data completeness %, model coverage |
| Operations | Treat service as a core operating system | Remote diagnostics, predictive maintenance, local spares, SLA playbooks | Higher uptime, lower MTTR | MTTR, MTBF, service response SLA |
| Operations | Upskill to a “thin but higher-skilled” workforce | Convert operators into automation techs; certify controls/OT roles | Sustained ROI and resilience | Technician/line ratio, downtime incidents |
| Ops + Security | Institutionalize governance & compliance early | Data governance, model traceability, safety certification routines | Lower risk, faster audits | Audit pass rate, incident rate |
“Next 90 Days” Priorities (Practical rollout plan)
Finance (0–90 days)
- Audit revenue mix: hardware vs services vs software; set target attach rates.
- Build a standard deal structure with milestone billing tied to commissioning success.
Marketing (0–90 days)
- Create a “Proof Kit” per vertical: ROI calculator + reference architecture + 2 case studies + a demo video.
- Identify top 25 target plants; run ABM + partner co-selling.
Operations (0–90 days)
- Select 2–3 repeatable use cases (e.g., vision QC + palletizing + intralogistics) and standardize reference cells.
- Implement baseline KPI dashboards: OEE, MTTR/MTBF, defect rate, time-to-commission.
8. Appendices & Sources
Raw Data Tables
A) Industry Snapshot (Macro + Automation)
| Category | Metric | Value | Unit | Year | Notes | Source (Clickable) |
|---|---|---|---|---|---|---|
| Macro | Manufacturing value added (current US$) | 4,661,441,540,000 | USD | 2024 | World Bank series NV.IND.MANF.CD | World Bank: NV.IND.MANF.CD (China) |
| Macro | Manufacturing value added (% of GDP) | ~25 | % | 2024 | World Bank series NV.IND.MANF.ZS | World Bank: NV.IND.MANF.ZS (China) |
| Automation | Industrial robot installations | 276,288 | Units | 2023 | Annual installations in China | IFR: China remains the world’s largest robot market |
| Automation | Operational stock of industrial robots | 1,755,132 | Units | 2023 | Estimated installed base in operation | IFR: China press release (installs + stock) |
| Automation | Robot density | 470 | Robots per 10,000 employees | 2023 | Automation intensity benchmark | IFR: Robot density rises again |
| Operations | Social logistics cost to GDP | 14.1 | % | 2024 | Official reporting citing CFLP | State Council: Logistics cost reporting (English) |
| Freight | World Container Index (WCI) | Varies (weekly) | USD per 40ft container | Weekly | Global freight benchmark series | Drewry: World Container Index |
B) Finance & Valuation Anchors (Public Comps; Industrial Software)
| Metric | Value | Unit | As of | Scope | Notes | Source (Clickable) |
|---|---|---|---|---|---|---|
| EV / Revenue (Median) | 9.1 | x | 2025-07-01 | Industrial software public comps | Forward multiple (2025E) from comps table | Houlihan Lokey: Industrial Software Market Update |
| EV / EBITDA (Median) | 22.2 | x | 2025-07-01 | Industrial software public comps | Forward multiple (2025E) from comps table | Houlihan Lokey: Industrial Software Market Update |
C) GTM Unit Economics Proxy (B2B SaaS Benchmarks Used as Proxy)
| Metric | 2022 | 2023 | Unit | Notes | Source (Clickable) |
|---|---|---|---|---|---|
| Blended CAC ratio (median) | 1.32 | 1.61 | $ S&M per $1 ARR | Proxy for acquisition efficiency (lower is better) | Pavilion: Benchmarks |
| New-name CAC ratio (median) | N/A | 1.76 | $ S&M per $1 ARR | New customer acquisition efficiency (2023 cited) | Pavilion: Benchmarks |
D) Representative M&A / Major Transactions (Source-linked subset)
| Buyer | Target | Segment | Announced / Closed | Deal Value | Currency | Notes | Source (Clickable) |
|---|---|---|---|---|---|---|---|
| SoftBank | ABB Robotics business | Industrial robotics | 2025-10-08 (announced) | 5.375 | Billion USD | Mega-deal highlighting AI+robotics platform consolidation | Context: IFR trends | Reuters: SoftBank–ABB Robotics |
| Haier Group | STEP Electric (control position) | Industrial robotics / automation | 2025-02 (announced) | 2.5 | Billion RMB | Industrial group acquiring robotics capability | YicaiGlobal: Haier–STEP Electric |
| Vista Equity Partners | Amtech Software | MES/ERP + automation software | 2025-06-16 (announced) | Undisclosed | N/A | Industrial software consolidation signal | Vista: Acquisition announcement |
| Synopsys | Ansys | Simulation / engineering software | 2025-07-17 (closed) | 35 | Billion USD | Closed after China SAMR approval with conditions | Reuters: Synopsys–Ansys close / SAMR conditions |
Hyperlinked Source List
Core Industry Scale & Macro
- World Bank – Manufacturing value added (China, current US$)
https://data.worldbank.org/indicator/NV.IND.MANF.CD?locations=CN - World Bank – Manufacturing value added (% of GDP, China)
https://data.worldbank.org/indicator/NV.IND.MANF.ZS?locations=CN - CSIS ChinaPower – China’s share of global manufacturing
https://chinapower.csis.org/china-manufacturing/
Robotics & Automation (Installations, Density, Trends)
- International Federation of Robotics (IFR) – World Robotics 2024 / China press release
https://ifr.org/ifr-press-releases/news/china-remains-the-worlds-largest-robot-market - IFR – Robot density statistics (China)
https://ifr.org/ifr-press-releases/news/robot-density-in-manufacturing-rises-again - IFR – Top Trends in Robotics 2025 (AI, humanoids, physical AI)
https://ifr.org/ifr-press-releases/news/top-5-robotics-trends-2025
Finance, M&A & Valuation Anchors
- Houlihan Lokey – Industrial Software Market Update (Fall 2025)
https://hl.com/insights/industrial-software-market-update/ - Houlihan Lokey – Public comps & valuation methodology
https://hl.com/services/financial-advisory/valuation/ - SoftBank acquisition of ABB Robotics (announced)
https://www.reuters.com/world/softbank-buy-abb-robotics-business-2025-10-08/ - Haier Group acquisition of STEP Electric (control stake)
https://www.yicaiglobal.com/news/haier-takes-control-of-step-electric - Vista Equity Partners acquisition of Amtech Software
https://www.vistaequitypartners.com/news/vista-equity-partners-acquires-amtech-software/ - Synopsys acquisition of Ansys (China SAMR approval)
https://www.reuters.com/world/china/china-clears-synopsys-35-bln-acquisition-ansys-2025-07-17/
Marketing, Buyer Behavior & GTM
- Gartner – B2B Buying Journey & Rep-Free Preferences
https://www.gartner.com/en/sales/trends/future-of-b2b-buying - McKinsey – B2B Pulse 2024 (Omnichannel buying)
https://www.mckinsey.com/capabilities/growth-marketing-and-sales/our-insights/the-b2b-pulse - Pavilion – 2024 SaaS Benchmarks (CAC ratios)
https://www.joinpavilion.com/benchmarks
Operations, Logistics & Supply Chain
- China Federation of Logistics & Purchasing (CFLP) – Social logistics cost ratio
http://www.chinawuliu.com.cn/ - State Council of China – Logistics cost reduction reporting
https://english.www.gov.cn/news/202401/xxc.html - Drewry – World Container Index (freight benchmark)
https://www.drewry.co.uk/supply-chain-advisors/supply-chain-expertise/world-container-index
Demographics & Labor Context
- National Bureau of Statistics of China – Population & labor data
https://www.stats.gov.cn/english/ - Reuters – China population decline and labor implications
https://www.reuters.com/world/china/chinas-population-decline-economic-impact-analysis-2025/
Notes on Data Limitations / Methodology
- M&A completeness: China domestic automation/robotics M&A is partially opaque (undisclosed values, fragmented disclosures). The deal table is representative and source-confirmed, not exhaustive.
- Unit economics (LTV:CAC): Direct LTV and gross margin disclosure is inconsistent for private industrial AI/robotics companies. Where needed, I used B2B SaaS CAC ratios as a proxy for GTM efficiency (appropriate primarily for software-led vendors).
- Forecasts: Any forward-looking allocations (e.g., spend shifts) are scenario-based directional estimates, intended for strategic planning—not investment guidance.
Disclaimer: The information on this page is provided by Manufacturing.co for general informational purposes only and does not constitute financial, investment, legal, tax, or professional advice, nor an offer or recommendation to buy or sell any security, instrument, or investment strategy. All content, including statistics, commentary, forecasts, and analyses, is generic in nature, may not be accurate, complete, or current, and should not be relied upon without consulting your own financial, legal, and tax advisers. Investing in financial services, fintech ventures, or related instruments involves significant risks—including market, liquidity, regulatory, business, and technology risks—and may result in the loss of principal. Manufacturing.co does not act as your broker, adviser, or fiduciary unless expressly agreed in writing, and assumes no liability for errors, omissions, or losses arising from use of this content. Any forward-looking statements are inherently uncertain and actual outcomes may differ materially. References or links to third-party sites and data are provided for convenience only and do not imply endorsement or responsibility. Access to this information may be restricted or prohibited in certain jurisdictions, and Manufacturing.co may modify or remove content at any time without notice.