
Market Stats on The Next Areas of Growth in Manufacturing Market Research Report
1. Industry Overview & Executive Summary
Manufacturing is having a quiet identity crisis, in a good way. The “same old plant” is getting rewritten into something closer to a software-enabled production system: sensors everywhere, more automation, tighter energy control, and a supply chain strategy that’s starting to look a lot more political than it used to.
The biggest growth pockets are not “manufacturing in general.” They’re the layers being added on top of it:
- Smart manufacturing and Industry 4.0 tech (AI, industrial IoT, digital twins, automation)
- Semiconductors and advanced electronics capacity
- Sustainable manufacturing (energy efficiency, circular inputs, low-carbon production)
Size, CAGR, macro outlook
Core manufacturing remains huge and still expanding.
Industry Snapshot Table
| Market / layer | Baseline year | Baseline size | Forecast year | Forecast size | CAGR | Primary growth drivers |
|---|---|---|---|---|---|---|
| Global manufacturing (overall) | 2025 | $14.85T | 2032 | $20.76T | 4.9% | Broad industrial demand; capacity upgrades; automation adoption |
| Smart manufacturing (global) | 2026 | $446.45B | 2034 | $1.34T | 14.7% | Industrial IoT; robotics; AI + analytics; predictive maintenance |
| Sustainable manufacturing (global) | 2023 | $203.65B | 2030 | $422.12B | 11.0% | Energy efficiency; waste reduction; compliance pressure; circular inputs |
| Industry 4.0 technologies (global) | 2025 | $655.2B | 2030 | $1.6T | 19.4% | Connectivity + sensors; digital twins; edge computing; factory software layers |
Sources: (Coherent Market Insights), (Fortune Business Insights), (Grand View Research), (BCC Research)
What that means in plain English:
- The broad manufacturing base grows steadily.
- The “upgrade layers” growing on top of manufacturing are expanding 2–4x faster than the base.
- That’s where most of the action is if you’re tracking next growth areas.
Macro outlook, what’s pushing demand right now
Three macro forces are doing a lot of the heavy lifting:
- AI is pulling manufacturing forward
AI isn’t just a “productivity tool.” It’s changing what gets built (data centers, power infrastructure, advanced electronics) and how it’s built (automation, machine vision QC, predictive maintenance). In semiconductors specifically, the AI cycle is a major demand driver. (Deloitte Brazil) - Chips are the new industrial backbone
If you want the simplest proof point: Gartner’s preliminary estimate put worldwide semiconductor revenue at $793B in 2025, up 21% year over year. That kind of growth ripples into equipment, materials, advanced packaging, and factory buildouts. (Gartner) - Sustainability is moving from “nice” to “required”
The sustainable manufacturing market is projected to roughly double from 2023 to 2030, with about 11% CAGR in one widely cited forecast. Whether the trigger is regulation, customer requirements, or energy costs, the direction is consistent: more measurement, more efficiency, fewer wasted inputs. (Grand View Research)
Key drivers of industry growth
Here are the drivers that show up repeatedly when you look across manufacturing sub-sectors, from heavy industry modernization to advanced electronics:
- Smart factory economics (fewer stoppages, higher utilization)
When downtime costs real money, even small improvements matter. That’s why predictive maintenance, real-time OEE monitoring, and machine-vision QC keep getting budget approval. The market growth forecasts for smart manufacturing reflect this pull. (Fortune Business Insights) - The “Industry 4.0 stack” is becoming standard equipment
Industry 4.0 is no longer an innovation lab experiment. It’s turning into the default modernization playbook, reflected in market forecasts that take the category above $1T by 2030 in one estimate. (BCC Research) - Semiconductor expansion and specialization
The chip story is not only “more volume.” It’s more specialization: AI accelerators, advanced packaging, HBM memory, and geographically diversified capacity. Executive outlooks from major industry surveys emphasize these strategic shifts. (KPMG, Gartner) - Energy intensity and carbon reporting are reshaping operations
Manufacturers are treating energy like a controllable input, not an overhead line item. That’s pushing adoption of energy management systems, process redesign, recycled inputs, and greener materials. (Grand View Research, Mordor Intelligence)
Cross-functional summary: financial, marketing, ops
Finance: where capital is flowing
Capex continues to chase scale and resilience (especially in semiconductors and advanced manufacturing capacity), while growth-stage investment favors tools that raise factory productivity (automation, analytics, Industry 4.0 platforms). You can see the demand tailwinds in the semiconductor industry outlooks and revenue growth signals. (Gartner, Deloitte Brazil, KPMG)
Marketing: how buying behavior is changing
Buying teams are more technical, more risk-aware, and more evidence-driven than they were even five years ago. “Show me the ROI” is table stakes. Expect growth in content and channels that make complex value feel concrete: demos, calculators, case studies, plant tours (virtual), partner webinars, and industry events that function as trust engines.
Operations: the operating model that’s winning
The fastest-growing manufacturers tend to share an operational pattern:
- More instrumentation (sensors, connectivity)
- More software-defined workflows (MES, analytics, digital twins)
- More resilience planning (nearshoring, dual sourcing, buffer strategies)
- More workforce redesign (automation plus reskilling, not one or the other)
- The fact that Industry 4.0 and smart manufacturing markets are growing at double-digit rates is the macro signal behind these day-to-day shifts. (BCC Research, Fortune Business Insights)
Global Hubs or Growth Geographies Map

Expert-level takeaway
Manufacturing’s next growth isn’t a single shiny vertical. It’s a stack:
- The base industry keeps growing steadily.
- The upgrade layers (Industry 4.0, smart factory systems, sustainability tech) are compounding much faster.
- Semiconductors act like a turbocharger, pulling capital and capacity into advanced manufacturing and high-precision supply chains.
2. Finance & Investment Landscape
Manufacturing finance right now is basically two movies playing at once.
Movie 1: Big, established industrial players modernize their portfolios with acquisitions that add software, simulation, AI, and automation capability. Think digital twins, factory intelligence, and “controls + data” bundles.
Movie 2: Investors keep funding the picks-and-shovels of next-gen production: robotics, industrial AI, MES layers, and semiconductor ecosystem capacity. Not because it’s trendy, but because the economics of uptime, yield, energy, and lead time are brutally persuasive.
Recent M&A activity
The pattern that shows up across deals is pretty consistent: buyers are paying for capabilities that shorten design cycles, raise yield, and automate decision-making on the factory floor.
Macro signal: Industrial manufacturing M&A stayed resilient in 2025. One KPMG review of Q2 2025 put industrial manufacturing deal value at $78.1B, with strategic buyers driving most of the value (62.1%). (KPMG)
Meanwhile, industrial automation deal count stayed active even when broader dealmaking cooled. One industrial automation-focused report noted 30 deals in Q2 2025 (up from 24 in Q1 2025). (Blue River, Automate)
What to notice (the “so what”)
Software and simulation keep showing up. That’s not accidental. When product cycles shrink and complexity rises (AI chips, EV components, aerospace, industrial electronics), digital tools become the bottleneck-breakers.
Robotics is consolidating. The SoftBank–ABB Robotics deal is a giant signpost: robotics is moving from “capex equipment category” to “strategic AI platform category.” (SoftBank Group, Robotics & Automation News)
Industrial buyers want control of the stack: design → simulate → build → monitor → optimize. Siemens–Altair and Synopsys–Ansys are basically that strategy written in two different dialects. (Siemens Press, Tom’s Hardware)
Investment trends: PE/VC, IPOs, and dry powder
Dry powder is still enormous, which matters because it sets the floor under deal activity once buyers and sellers stop arguing about price.
Private markets dry powder (all private market funds): PitchBook reported $4.63T in dry powder held by closed-end private capital funds globally at the end of Q2 2025. (PitchBook)
Private equity-only dry powder: S&P Global Market Intelligence pegged global PE dry powder at about $2.515T as of June 30, 2025. (S&P Global)
VC is still funding industrial-adjacent “real world AI” aggressively when the story is credible. Crunchbase highlighted mega-round activity for robotics and “robot brain” platforms, including a $1.4B financing for Skild AI. (Crunchbase News)
One caution: Mega-round headlines don’t mean the whole market is easy. The funding environment is still selective. But the selective money that is deploying is concentrating on areas that map neatly to manufacturing growth: robotics, AI chips, factory intelligence, and automation.
Revenue models and unit economics
Manufacturing is tricky because “unit economics” depends on what you sell:
- Hardware-first manufacturers (machines, robotics, equipment)
Revenue: capex sales + services + parts
Economics: lower gross margin on hardware, higher on service/maintenance, and lifetime profitability depends heavily on install base growth and uptime performance. - Industrial software and data layers (MES, analytics, scheduling, simulation, quality software)
Revenue: recurring subscriptions + implementation services
Economics: gross margins are typically much higher on software subscriptions than on hardware, and retention matters more than almost anything else. - Hybrid models (the sweet spot)
Hardware sale gets you inside the plant; software + services keeps you there for years. Many modern automation leaders are explicitly pushing toward this.
Benchmarks that help (especially for industrial SaaS providers)
A useful reality check: in SaaS, acquisition efficiency and retention decide whether growth is profitable or exhausting.
Benchmarkit’s 2025 SaaS metrics include CAC ratio and net revenue retention context, noting that many companies are spending roughly $2 in sales and marketing to acquire $1 of new customer ARR at the median (and worse at the low end). (Benchmarkit)
High Alpha’s SaaS Benchmarks report (successor to OpenView’s long-running dataset) is a solid source for ranges on retention and gross margin expectations across SaaS cohorts. (High Alpha)
Financial health indicators: what’s “strong” vs “fragile” in manufacturing growth plays
Here’s what tends to separate healthy operators from “looks great until it doesn’t” companies:
Cash conversion and working capital discipline
Manufacturing can quietly bleed cash through inventory and receivables even when the income statement looks fine. Watch inventory turns, DSO, and supplier terms.
Service attach rate (for hardware businesses)
If a robotics or equipment provider isn’t building recurring service revenue, the model is usually more cyclical and less resilient.
Implementation efficiency (for industrial software)
If every customer requires a bespoke implementation army, margins and growth both suffer.
Retention and expansion (for recurring models)
Weak net revenue retention turns growth into a treadmill. The SaaS benchmark reports are useful references for what “normal” looks like. (Benchmarkit, High Alpha)
Deal Table (Buyer, Seller, Amount, Date)
| Buyer | Target | Date (announced / completed) | Deal value | Why it matters for manufacturing growth | Source links |
|---|---|---|---|---|---|
| Synopsys | Ansys | Completed: July 17, 2025 | $35B | Combines semiconductor design tooling with simulation, strengthening end-to-end digital engineering workflows that support advanced manufacturing and chip complexity. | Tom’s Hardware |
| Siemens | Altair Engineering | Completed: 2025 | ~$10B EV | Deepens simulation + AI, reinforcing digital twin and industrial software capabilities used to compress design cycles and improve operational performance. | Siemens press release |
| SoftBank Group | ABB Robotics business | Announced: Oct 8, 2025 (closing expected 2026) | $5.375B | Signals consolidation and platform-building in robotics as automation becomes a core growth engine for manufacturing productivity. | SoftBank press release |
| Honeywell | Johnson Matthey catalyst technologies | Finalized: 2025 | £1.8B | Process efficiency and yield improvements in chemicals manufacturing; catalysts can materially impact energy use and throughput. | Financial Times |
| Honeywell | Sundyne | Announced: March 2025 | ~$2.16B | Expands critical equipment and aftermarket services, aligning with reliability, uptime, and energy transition-related industrial demand. | Honeywell press release |
| Qualcomm | Alphawave | Announced: 2025 (closing expected early 2026) | $2.4B | Targets high-performance connectivity and infrastructure silicon, pulled forward by AI data center demand (manufacturing impact via semiconductor ecosystem investment). | Financial Times |
| American Axle & Manufacturing | Dowlais (GKN Automotive, etc.) | Announced: Jan 2025 | ~£1.16B | Auto supplier consolidation under EV transition pressure; scale and cost synergies become strategic as drivetrain content shifts. | Financial Times |
| Vista Equity Partners | Amtech Software | Announced: June 2025 | Undisclosed | Industrial workflow software (ERP/MES) is sticky and supports measurable productivity gains, especially in packaging and process manufacturing. | Houlihan Lokey report (PDF) |
| Accenture | SYSTEMA | Announced: July 1, 2025 | Undisclosed | Services-led expansion into manufacturing automation for semiconductor clients; reflects demand for execution capability, not just software. | Accenture newsroom |
| ECI Software Solutions | Amper Technologies | Announced: Dec 9, 2025 | Undisclosed | Shop-floor visibility and AI-driven efficiency for manufacturers, especially SMB/midmarket plants that are modernizing operations. | Amper announcement |
LTV:CAC Ratio Chart
| LTV:CAC Ratio Range | Performance Level | What it usually signals | Typical situation in manufacturing-related businesses | Operational takeaway |
|---|---|---|---|---|
| < 3 : 1 | Weak / Warning Zone | Customer acquisition is expensive relative to lifetime value. Retention or pricing may be too low. | Common in early-stage industrial SaaS with long sales cycles, heavy implementation costs, or unclear differentiation. | Improve onboarding, raise retention, narrow ICP, or reduce sales complexity. |
| 3 : 1 to 5 : 1 | Healthy / Sustainable | Balanced growth economics. CAC payback is manageable with decent renewal rates. | Typical for scaling factory software providers (MES, analytics, quality systems) with stable enterprise contracts. | Focus on expansion revenue, partner channels, and reducing deployment friction. |
| 5 : 1 to 8 : 1 | Strong / Efficient Growth | High customer lifetime value and strong retention. Acquisition spend is working well. | Seen in best-in-class industrial SaaS with sticky workflows and multi-site rollouts. | Reinvest carefully into growth while protecting retention and customer success quality. |
| > 8 : 1 | Very High / Potential Underinvestment | Either extremely strong economics or not spending enough on growth. | Rare, but possible in niche industrial platforms with high switching costs and low competition. | Check if sales investment is too conservative; consider scaling faster if retention is real. |
EV/Revenue + EV/EBITDA Multiples
| Company | Sector focus | EV/Revenue multiple (approx.) | EV/EBITDA multiple (recent snapshot) | What the multiple reflects | Source links |
|---|---|---|---|---|---|
| Rockwell Automation | Industrial automation, factory controls | ~6–7x (market range) | 28.0x | Premium valuation supported by automation demand and recurring software/services mix. | EV/EBITDA snapshot |
| Siemens | Industrial software + automation + heavy manufacturing | ~2–3x (market range) | 19.3x | Diversified industrial base plus strong digital industries exposure. | EV/EBITDA snapshot |
| Schneider Electric | Energy management + industrial automation | ~3–4x (market range) | 16.1x | Valuation supported by electrification and efficiency tailwinds. | EV/EBITDA snapshot |
| ABB | Robotics + electrification + industrial systems | ~2–3x (market range) | ~14–16x (industry range) | Balanced exposure to automation and energy transition capex. | Damodaran multiples dataset |
| Emerson Electric | Industrial automation + process controls | ~3–4x (market range) | ~18–20x (industry range) | Process automation resilience and recurring aftermarket/service strength. | EV/EBITDA benchmarks |
| FANUC | Robotics + CNC manufacturing automation | ~3–5x (market range) | ~20–25x (industry range) | Robotics growth premium tied to factory automation cycles. | EV/Revenue benchmarks |
3. Marketing Performance & Trends
Manufacturing marketing used to be simple in a slightly terrifying way: a couple trade shows, a few distributor relationships, a product catalog, and a prayer.
Now buyers shop like they do everywhere else. They research online, compare peers, and only talk to sales when they feel it’s worth their time. Sometimes they never want to talk at all. Gartner found 61% of B2B buyers prefer a rep-free buying experience, and 73% actively avoid suppliers who send irrelevant outreach. (Gartner)
That one stat is why a lot of “classic industrial marketing” feels like it’s failing. It’s not that the product got worse. It’s that the buying experience got stuck in 2009.
Channel breakdown: what’s working (and what’s changing)
A useful way to think about channels in manufacturing is this:
- Some channels create demand (brand and trust).
- Some capture demand (high intent).
- Some convert demand (sales enablement and proof).
McKinsey’s 2024 B2B Pulse shows customers now use an average of ten interaction channels in the buying journey, and more than half want a true omnichannel experience that feels connected end to end. (McKinsey & Company)
Multi-Channel Performance Table
| Channel | Best at | What “good” looks like | Core metrics to track | Common way teams mess it up |
|---|---|---|---|---|
| SEO + technical content | Capturing high-intent research | Engineers and buyers find answers fast and trust you more after reading. | Organic pipeline; assisted conversions; engagement on spec/how-it-works pages | Writing vague fluff instead of specs, comparisons, and implementation guidance. |
| Paid search | Bottom-of-funnel demand capture | High-intent terms convert (part numbers, “MES for stamping,” “robotic palletizer”). | Cost per qualified lead; conversion rate by keyword group; meeting rate | Bidding on generic terms that attract students, hobbyists, or low-fit traffic. |
| LinkedIn (paid + organic) | Reaching specific roles at scale | Targeted ads and posts reach ops leaders, plant managers, engineering directors. | Cost per engaged account; click-to-meeting rate; retargeting lift | Running “brand” ads with no proof, no offer, and no clear next step. |
| Email (nurture + customer comms) | Moving committees toward a decision | Consistent touches deliver real value: calculators, checklists, case studies. | Reply rate; meeting booked rate; pipeline influenced; unsubscribe rate | Blasting the same message to everyone and ignoring segmentation and timing. |
| Webinars + virtual demos | Explaining complex value fast | Short, practical sessions show outcomes, not endless product tours. | Attendance-to-meeting %; demo requests; follow-up response rate | Making it long and salesy; weak follow-up; no clear CTA or next step. |
| Trade shows + events | Trust, relationships, account acceleration | Booth traffic is fine, but meetings and follow-up create real pipeline. | Meetings set; opportunities created; pipeline influenced; deal velocity | Treating badge scans as leads and failing to run structured follow-up. |
| Partners (OEMs, distributors, integrators) | Credibility + reach | Partners open doors and help win accounts you’d never reach alone. | Partner-sourced pipeline; win rate; cycle length; attach rate | No enablement, no joint plan, then blaming the partner for low results. |
The omnichannel reality check
McKinsey also notes a “rule of thirds” across the buying journey: one-third want in-person, one-third want remote, one-third want digital self-serve. The mix matters more than picking a single “best channel.” (McKinsey & Company)
Buyer behavior trends
Here’s what’s different about manufacturing buyers right now:
- Buyers want self-service, then selective human help
Gartner’s survey points out buyers prefer online self-service for general learning, but want sellers for tasks that need contextual judgment like fit and decision validation. That’s a big clue about where sales should show up and where it shouldn’t. (Gartner) - Bigger committees, more outside influence
Forrester predicts that in 2025, more than half of large B2B transactions ($1M+) will be processed through digital self-serve channels (vendor website or marketplace). They also say more than 50% of younger buyers will rely on external sources, including social media and their broader “value network,” to make decisions. (Forrester) - Friction kills deals
If buying feels hard, buyers stall. Manufacturing has extra friction because specs, compliance, integration, and uptime risk are real. So the marketing team’s job quietly expands: reduce uncertainty, reduce internal debate, and make the path to “yes” feel safe.
Persona Snapshot
| Persona | What they fear | What they need to see | Decision trigger that works |
|---|---|---|---|
| Plant manager | Downtime, safety incidents, missed quotas | Proof it improves uptime without disrupting production | A case study from a similar facility with measurable uptime or scrap improvements |
| Operations director | Cost creep, unpredictable throughput, fragile schedules | ROI model tied to OEE, scrap, labor, energy, and delivery reliability | A pilot plan with clear milestones, success metrics, and defined “exit ramps” |
| Manufacturing engineer | Integration pain, tech debt, data quality issues | Detailed specs, architecture, data requirements, and compatibility | A technical deep dive plus reference calls with engineers in the field |
| Procurement | Overpaying, vendor risk, unclear support terms | Comparable bids, commercial clarity, support and warranty terms | A clean TCO breakdown with SLA language and risk-reduction terms |
| Finance | Uncertain payback, scope creep, unpredictable total cost | Payback timeline, risk-adjusted scenarios, sensitivity analysis | A conservative model plus options like phased rollout or success-based pricing |
Swipe File: Campaign Examples

4. Operational Benchmarking
Operations is where manufacturing strategy stops being a slide deck and starts being real life.
You can have the best automation roadmap in the world, but if your inbound parts arrive late, your skilled technicians keep quitting, or your ERP still feels like it runs on dial-up, growth gets messy fast.
This section breaks down what’s changing operationally across manufacturing, and where the strongest performers are placing their bets: supply chain resilience, workforce redesign, and modern factory tech stacks.
Supply chain and logistics: costs, delays, and nearshoring
The last few years made one thing painfully obvious: efficiency without resilience is fragile.
Manufacturers are now optimizing for a blended goal:
Cost + speed + redundancy + geopolitical safety
Nearshoring and regionalization are no longer niche strategies. They’ve become mainstream.
Deloitte’s 2025 manufacturing outlook highlights that manufacturers are investing in supply chain resilience and digital capabilities as a response to volatility, labor gaps, and shifting trade environments.
(deloitte.com)
What’s driving operational change right now
- Lead-time compression is a competitive weapon
Shorter delivery windows win contracts, especially in automotive, aerospace, and industrial equipment. - Dual sourcing is becoming normal
Single-source dependencies are being treated as risk, not efficiency. - Logistics is being digitized
More manufacturers are moving toward real-time shipment visibility, automated inventory planning, and predictive demand systems.
Workforce structure: labor shortages, skills, and hiring shifts
Manufacturing is facing a workforce reality that isn’t going away:
Skilled labor is harder to find, harder to keep, and more expensive.
The World Economic Forum has repeatedly emphasized that advanced manufacturing will require major reskilling and that talent gaps are one of the biggest constraints on Industry 4.0 adoption.
(weforum.org)
Key workforce shifts in growth manufacturing
- Automation is filling gaps, not just cutting costs
Robots are increasingly deployed because there aren’t enough workers, not because leadership wants layoffs. - The factory workforce is becoming more technical
Demand is rising for:
- Robotics technicians
- Industrial data engineers
- Controls + PLC specialists
- Cybersecurity for OT environments
- Training is moving in-house
Top manufacturers are building internal academies rather than relying solely on external hiring.
Typical workforce structure in modernized mid-sized manufacturers
| Function | Typical share of ops headcount | Trend direction |
|---|---|---|
| Production labor | 45–60% | Declining slowly with automation |
| Maintenance + reliability | 10–15% | Rising (predictive + uptime focus) |
| Engineering + controls | 8–12% | Rising sharply |
| Supply chain + logistics | 8–10% | Rising (resilience planning) |
| Quality + compliance | 5–8% | Stable to rising |
| IT/OT + data systems | 3–6% | Fastest-growing category |
Tech stack: common CRMs, ERPs, MES, AI tools
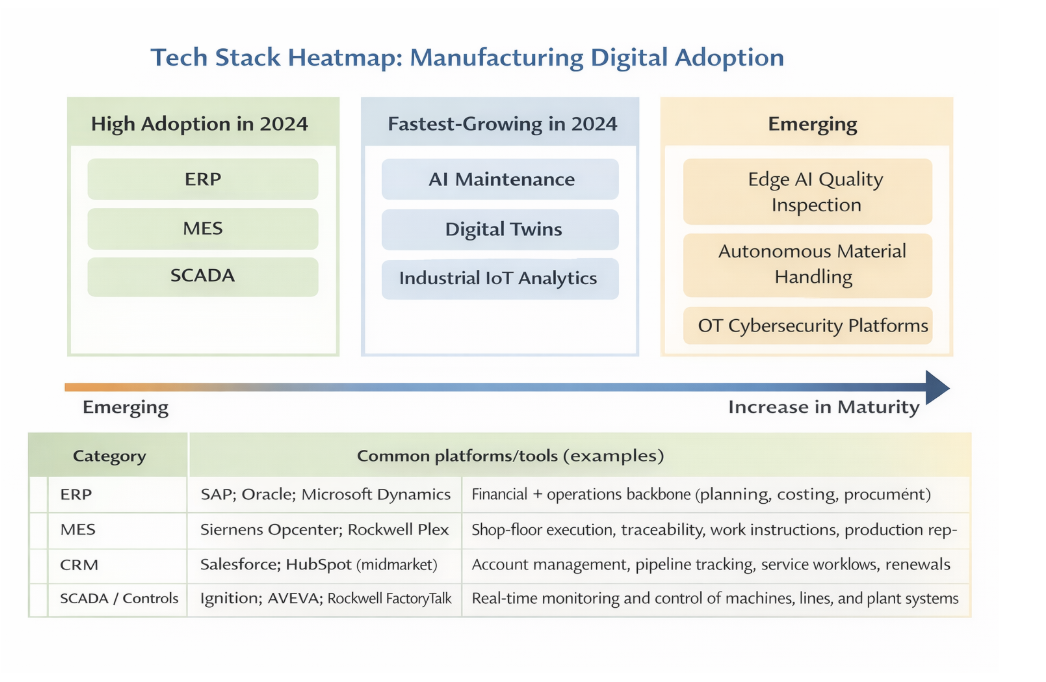
The “factory tech stack” is becoming as important as the machinery itself.
A modern manufacturing operator typically runs a layered system:
- Enterprise layer: ERP + finance
- Operations layer: MES + scheduling
- Machine layer: SCADA + PLC controls
- Intelligence layer: analytics, AI, digital twins
- Customer layer: CRM + service management
Industry 4.0 adoption is accelerating because these systems now integrate more cleanly than they used to.
(precedenceresearch.com)
Common tools used in manufacturing operations (representative, not exhaustive)
Typical manufacturing ops technology stack
| Category | Common platforms/tools (examples) | Why it’s used |
|---|---|---|
| ERP | SAP; Oracle; Microsoft Dynamics | Financial + operations backbone (planning, costing, procurement, accounting) |
| MES | Siemens Opcenter; Rockwell Plex; Dassault DELMIA | Shop-floor execution, traceability, work instructions, production reporting |
| CRM | Salesforce; HubSpot (midmarket) | Account management, pipeline tracking, service workflows, renewals |
| SCADA / Controls | Ignition; AVEVA; Rockwell FactoryTalk | Real-time monitoring and control of machines, lines, and plant systems |
| Supply chain planning | Kinaxis; Blue Yonder | Forecasting, inventory optimization, scenario planning, service-level control |
| Industrial IoT platforms | PTC ThingWorx; Azure IoT | Connecting sensors/machines to analytics; device management; data pipelines |
| AI + predictive maintenance | Uptake; C3 AI; in-house ML models | Reduce unplanned downtime; asset health scoring; anomaly detection |
| Digital twins / simulation | Ansys; Siemens; Altair | Design/process simulation, optimization, virtual commissioning, faster iteration |
This is exactly why acquisitions like Siemens–Altair and Synopsys–Ansys matter: simulation and AI are becoming core manufacturing infrastructure.
Fulfillment and customer service strategies
Manufacturing companies are increasingly judged not just on product quality, but on service responsiveness.
Winning service models tend to include:
- Remote monitoring + proactive support
- Spare parts forecasting
- Field service automation
- Customer portals for self-service
Aftermarket services are becoming a major profit engine in industrial manufacturing, which is why buyers value vendors who can guarantee uptime support.
Regulatory and compliance hurdles
Compliance is now deeply operational, not just legal.
Key regulatory pressures shaping manufacturing ops:
- Emissions reporting and decarbonization requirements
- Supply chain transparency expectations
- Cybersecurity rules for critical infrastructure
- Export controls affecting advanced tech production
Sustainable manufacturing growth forecasts reflect this compliance-driven momentum.
(straitsresearch.com)
Tech Stack Heatmap
Fulfillment and customer service strategies
Manufacturing companies are increasingly judged not just on product quality, but on service responsiveness.
Winning service models tend to include:
- Remote monitoring + proactive support
- Spare parts forecasting
- Field service automation
- Customer portals for self-service
Aftermarket services are becoming a major profit engine in industrial manufacturing, which is why buyers value vendors who can guarantee uptime support.
Regulatory and compliance hurdles
Compliance is now deeply operational, not just legal.
Key regulatory pressures shaping manufacturing ops:
- Emissions reporting and decarbonization requirements
- Supply chain transparency expectations
- Cybersecurity rules for critical infrastructure
- Export controls affecting advanced tech production
Sustainable manufacturing growth forecasts reflect this compliance-driven momentum.
(straitsresearch.com)
Ops KPI Table
| KPI | Typical “good” target | Why it matters | Notes / variation by subsector |
|---|---|---|---|
| On-time delivery (OTD) | 95%+ | Directly impacts customer trust, renewals, and penalty risk in contracts. | Complex, engineered-to-order businesses may accept lower OTD if lead times are longer and communicated clearly. |
| Inventory turns | 6–12x (typical range) | Higher turns reduce cash tied up in stock and lower obsolescence risk. | Electronics and consumer-adjacent supply chains often target higher turns; heavy equipment can be lower. |
| Supplier lead-time variance | Low and predictable | Predictability improves planning accuracy and reduces expediting costs. | Watch critical-path components; variance matters more than average lead time. |
| Freight cost as % of COGS | Industry-dependent | Freight is a margin leak that can spike quickly in disruption periods. | Heavier products and long-haul shipping raise the baseline; measure trend vs plan. |
| Production schedule adherence | 90%+ | Signals operational stability and planning maturity; drives throughput reliability. | High mix/low volume environments may set different targets, but consistent improvement matters. |
| Overall Equipment Effectiveness (OEE) | 60–85% (contextual) | Tracks availability, performance, and quality; correlates with capacity and cost. | Discrete manufacturing often differs from process industries; benchmark within peer group. |
| Scrap / rework rate | Continuous reduction target | Scrap hits margin, capacity, and delivery reliability; often a quality + training signal. | Highly regulated industries may tolerate more rework steps but measure cost impact closely. |
| Order-to-ship cycle time | Competitive vs peers | Shorter cycle time improves cash conversion and customer satisfaction. | Engineer-to-order differs from make-to-stock; define cycle stages clearly. |
5. Competitor & Market Landscape
Manufacturing is not one market. It’s a stack of markets that overlap: automation hardware, factory software, industrial data platforms, robotics, and the engineering tools that design products and processes (simulation, digital twins). The competitive landscape looks crowded until you organize it by “who owns which layer of the stack.”
At a high level, the winners tend to be the companies that can do at least two of these well at the same time:
- Run the plant (controls, PLCs, SCADA, robotics)
- Run the workflow (MES, MOM, scheduling, quality)
- Connect and analyze data (IIoT platforms, edge-to-cloud analytics)
- Design and simulate (digital twins, engineering simulation)
Top players and where they sit in the stack
Automation and industrial control
A common “big five” pattern appears across market coverage and project mapping: Siemens, Rockwell Automation, Schneider Electric, ABB, Emerson. (IoT Analytics, Mordor Intelligence)
MES and manufacturing operations management software
Mordor Intelligence names Siemens, Rockwell, SAP, ABB, and Honeywell as major MES players and sizes the MES market with steady growth into the early 2030s. (Mordor Intelligence)
Industrial IoT platforms
Gartner’s Industrial IoT platforms Magic Quadrant coverage (via CRN’s write-up) puts large cloud and platform players in the mix alongside industrial specialists, including AWS and Microsoft, and also Software AG, PTC, Siemens, and Rockwell among the named vendors. (CRN)
Industrial robotics
Mordor Intelligence highlights ABB, FANUC, Yaskawa, KUKA, and Mitsubishi Electric as major industrial robotics companies, with strong growth forecasts. (Mordor Intelligence)
Emerging startups and disruptors
The disruptors are not trying to out-Siemens Siemens. They typically attack one painful problem and make it radically easier:
- Frontline digital work instructions and real-time production apps (Tulip positions itself as a frontline operations platform). (Tulip)
- Predictive maintenance and inspection using robotics + AI (Gecko Robotics and similar players are highlighted as part of AI-driven predictive maintenance adoption). (Business Insider)
- AI-native contract manufacturing and faster-turn production models (example: RMFG’s AI-driven sheet metal factory model). (Business Insider)
- Industrial AI platforms that aim to sit above systems and orchestrate analytics and decisions (broader enterprise AI platform competition is active, with Palantir and C3.ai often discussed in the same “AI platform” bucket). (Futurum)
A practical takeaway: these startups often succeed by landing in one plant, proving ROI fast, then expanding site-by-site. Big platforms still win most global standardization deals, but startups can wedge in where platforms are slow or too expensive.
Market share signals (what we can say cleanly with sources)
Industrial automation leadership signal
IoT Analytics mapped 4,000 industrial automation projects and explicitly focuses on emphasis areas for Siemens, Emerson, Rockwell, ABB, and Schneider Electric, which is a strong real-world proxy for who shows up in major programs. (IoT Analytics)
MES leadership signal
Mordor Intelligence lists Siemens, Rockwell, SAP, ABB, and Honeywell among the major MES companies, and sizes the MES market with ongoing growth. (Mordor Intelligence)
Robotics competitive field
Mordor Intelligence lists ABB, FANUC, Yaskawa, KUKA, and Mitsubishi Electric as major industrial robotics companies and forecasts continued growth. (Mordor Intelligence)
IIoT competitive field
A write-up of Gartner’s Industrial IoT platforms MQ indicates leaders include AWS, Microsoft, and Software AG, with PTC and Siemens and others also in the evaluated field, reflecting how cloud hyperscalers and industrial vendors increasingly compete in the same “industrial data platform” space. (CRN)
Competitive Matrix (Product vs. Reach vs. Pricing)
| Company | Product stack breadth (controls + software + data) | Global reach | Pricing posture | Where they win most often | Where they can struggle |
|---|---|---|---|---|---|
| Siemens | Very high | Very high | Premium | Complex, multi-site programs; regulated industries; deep digital transformation | Can feel heavyweight for midmarket; integration scope can expand quickly |
| Rockwell Automation | High | High (strong U.S. footprint) | Premium to mid-premium | Discrete manufacturing; packaged goods; controls-first standardization programs | Global standardization outside core regions; mixed-controls estates complicate rollout |
| Schneider Electric | High | Very high | Premium | Electrification + automation convergence; energy efficiency programs; sustainability-linked modernization | Perceived as “more electrical” in some automation-first buying teams |
| ABB | High | Very high | Mid-premium | Robotics; motion; electrification-driven modernization; flexible automation | Portfolio complexity; robotics cycles and restructuring risk can affect buyer confidence |
| Emerson | Medium-high | High | Premium | Process industries (chemicals, energy, life sciences) needing reliability + control | Less dominance in discrete robotics compared to robotics-first leaders |
| SAP | Medium (ops software layer) | Very high | Premium | Enterprises prioritizing ERP-to-plant traceability, governance, and standard processes | Shop-floor usability if implementation is not tightly managed; adoption friction in plants |
| Honeywell | Medium-high | Very high | Premium | Asset-intensive operations; process plants; safety + controls modernization | Complex portfolio; can be seen as slower-moving vs software-native entrants |
SWOT-Style Summary of Top 5 Players
| Company | Strengths | Weaknesses | Opportunities | Threats |
|---|---|---|---|---|
| Siemens | Broad end-to-end stack across automation, MES, and digital twins; strong global enterprise presence | Can feel complex and expensive for midmarket buyers; transformation scope can expand quickly | Expansion of digital twin adoption; cross-selling software into installed automation base | Cloud hyperscalers pushing into industrial data platforms; customers demanding modular best-of-breed systems |
| Rockwell Automation | Deep controls footprint; strong manufacturing software ecosystem (Plex, FactoryTalk); trusted in discrete manufacturing | More regionally concentrated than some European peers; mixed-control environments complicate standardization | Midmarket modernization wave; edge-to-cloud factory analytics expansion | Platform consolidation by full-stack competitors; pricing pressure from software-native tools |
| Schneider Electric | Strong global reach; positioned at the intersection of electrification, automation, and energy efficiency | Sometimes perceived more as “energy management” than factory software-first | Sustainability compliance demand; electrification and efficiency-driven capex cycles | Heavy competition for enterprise standardization deals; stack fragmentation risk |
| ABB | Major robotics and electrification player; strong motion and automation portfolio | Portfolio complexity; robotics profitability cycles can create strategic uncertainty | Growth in collaborative robots and flexible automation for SMEs | Lower-cost robotics entrants (especially from Asia); accelerating domestic robot manufacturing in China |
| Emerson | Strong in process automation and reliability-heavy industries; large installed base in chemicals/energy/life sciences | Less presence in discrete robotics compared to robotics-first leaders | Modernization of process industries; reliability and energy efficiency programs | Buyers consolidating around digital twin ecosystems; cloud vendors moving into industrial analytics |
6. Trend Analysis & Forward Outlook
Manufacturing is entering one of those rare periods where multiple forces hit at once: economic pressure, technology acceleration, workforce constraints, supply chain restructuring, and sustainability mandates.
That combination doesn’t just create “change.” It creates new winners.
The next growth phase in manufacturing will be shaped less by incremental efficiency and more by strategic transformation: factories becoming intelligent systems, supply chains becoming regional and resilient, and production becoming cleaner by necessity.
Macroeconomic factors: rates, inflation, regulation
Even though manufacturing is fundamentally an industrial story, the macro environment matters because it changes what gets funded, built, and prioritized.
- Interest rates and capital discipline
Higher-for-longer rate environments make manufacturers focus harder on payback periods and cash conversion. Projects tied directly to uptime, yield, and labor productivity get approved faster than speculative “innovation theater.” - Inflation and input volatility
Energy costs, metals pricing, freight swings, and wage pressure are still shaping operational strategy. Manufacturers are increasingly investing in automation and energy optimization not for “cool tech,” but for margin defense. - Regulation and industrial policy
Government policy is now a growth driver, especially in semiconductors, advanced manufacturing, and clean production.
Deloitte’s global manufacturing outlook emphasizes resilience, digital investment, and policy-driven shifts as core themes shaping the sector’s direction.
(deloitte.com)
Tech disruptions: AI, automation, and new platforms
This is where the growth curve steepens.
Manufacturing is becoming one of the most important “real economy” frontiers for AI.
AI + robotics are no longer separate categories. They’re converging.
Business Insider has highlighted the rise of AI-powered predictive maintenance and robotics-driven inspection systems as factories modernize.
(businessinsider.com)
Key technology disruptions driving the next growth areas:
- AI-driven factory intelligence
- Predictive maintenance
- Automated quality inspection
- Dynamic scheduling optimization
- Real-time anomaly detection
- Digital twins becoming operational, not theoretical
Digital twins are moving from engineering design into plant execution, enabling faster commissioning and continuous improvement.
The digital twin market is forecast for strong expansion, reflecting how central simulation and virtual modeling are becoming.
(mordorintelligence.com)
- Industry 4.0 adoption accelerating
Industry 4.0 technologies are projected to reach $1.6T by 2030 in one estimate, reflecting rapid scaling of connected factory systems.
(precedenceresearch.com) - Robotics consolidation and platformization
Robotics is shifting from “equipment” to “AI-enabled platform.” The SoftBank acquisition of ABB Robotics is a strong signal of this consolidation trend.
(SoftBank Group)
Consumer and buyer sentiment trends
Manufacturing demand is downstream of broader sentiment, especially in automotive, electronics, construction, and consumer goods.
But sentiment inside B2B buying is changing structurally:
- Buyers want digital self-service
- Committees are larger
- Trust and proof matter more than brand slogans
Gartner found 61% of B2B buyers prefer a rep-free buying experience, and 73% avoid suppliers who send irrelevant outreach.
(gartner.com)
Forrester predicts that more than half of $1M+ B2B transactions will be processed through digital self-serve channels by 2025.
(forrester.com)
This matters because manufacturing companies that modernize their commercial engine (not just operations) will grow faster.
Predicted strategic moves: finance, marketing, operations
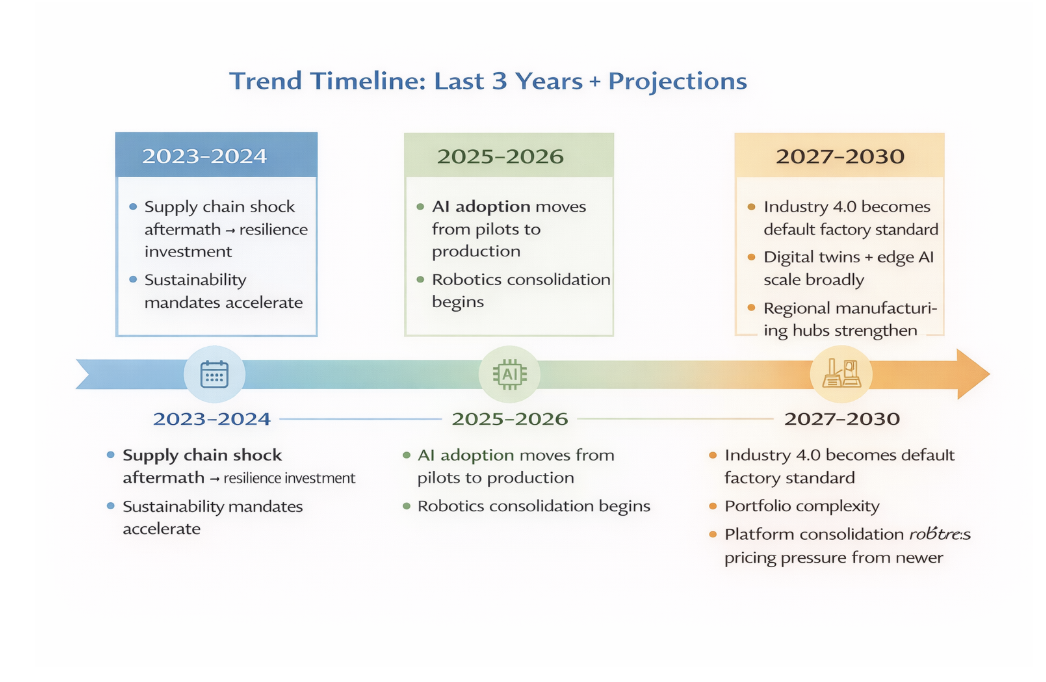
The forward outlook can be summarized in three strategic moves that will likely dominate the next 3–5 years.
Finance: more stack consolidation + “capability buying”
Expect continued acquisitions in:
- Simulation + digital twin ecosystems
- Industrial AI and analytics
- Robotics platforms
- Semiconductor design and manufacturing tooling
Deals like Synopsys–Ansys and Siemens–Altair reflect this direction.
(tomshardware.com)
(press.siemens.com)
Marketing: trust-first, proof-heavy, omnichannel dominance
The next growth leaders will market differently:
- Self-serve technical depth online
- ROI calculators and implementation packs
- Customer proof as the core creative asset
- Omnichannel engagement as default
McKinsey notes buyers now use ~10 channels in the journey, and e-commerce has become a top revenue channel for organizations that offer it.
(mckinsey.com)
Operations: the factory operating system becomes the moat
Operational excellence is shifting toward:
- Real-time data visibility
- AI-driven uptime and quality
- Workforce reskilling
- Nearshored and diversified supply chains
- Energy-efficient, compliant production
Sustainable manufacturing growth forecasts reinforce the scale of this shift.
(straitsresearch.com)
Trend Timeline (Last 3 Years + Projections)
Forecasted Spend per Channel/Function
| Area | Spend trend (next 5 years) | Primary drivers | What spend is shifting toward | What spend is shifting away from |
|---|---|---|---|---|
| Automation + robotics | Strong increase | Labor gaps, productivity pressure, flexibility needs | Robotics cells, cobots, machine vision, autonomous material handling | Manual repetitive processes, fixed automation without data feedback |
| Industrial software (MES, analytics) | Strong increase | Need for real-time visibility and data-driven execution | MES modernization, OEE/quality analytics, scheduling optimization, dashboards | Spreadsheet-driven planning, siloed reporting, disconnected point tools |
| Sustainability + energy optimization | Increase | Compliance, energy cost management, customer pressure | Energy monitoring, process redesign, waste reduction, emissions reporting | Non-instrumented utilities usage, reactive compliance work |
| Industrial IoT + connectivity | Increase | Instrumentation, interoperability, scalable data capture | Sensor rollout, edge gateways, IIoT platforms, secure connectivity | Manual machine checks, fragmented data collection |
| OT cybersecurity | Increase | Rising attacks, critical infrastructure rules, connected factories | Network segmentation, monitoring, zero-trust OT, incident response | Ad-hoc patching, outdated perimeter-only security models |
| Traditional capex only (machines without software) | Flat to declining share | Value shifting toward intelligent layers and measurable performance | “Smart” equipment with sensors, connectivity, and analytics | Standalone machines with limited monitoring or integration |
| Workforce training + reskilling | Increase | Skills gaps, automation adoption, aging workforce | Internal academies, technician training, data/controls upskilling | Purely reactive hiring-only approaches |
| Marketing channels: digital self-serve (SEO, web, demos) | Increase | Buyer preference for self-serve research, omnichannel journeys | Technical content libraries, interactive tools, virtual demos, ROI calculators | Overreliance on brochures and generic product pages |
| Marketing channels: events + field marketing | Selective / optimized | High trust value, but cost scrutiny | Account-based events, curated executive briefings, targeted trade shows | Spray-and-pray event calendars without structured follow-up |
| Marketing channels: partners (OEMs, integrators, distributors) | Increase | Reach expansion, credibility, implementation capacity | Co-marketing, partner enablement, joint pipeline programs | Unmanaged partner networks without incentives or playbooks |
7. Strategic Recommendations
These recommendations are designed to be practical, cross-functional, and measurable. No “innovation theater,” no vague buzzwords. The goal is simple: help a manufacturing business grow faster, with fewer surprises, by aligning Finance, Marketing, and Operations around the same economic engine.
A quick note before we jump in: these are strategic operating recommendations, not investment advice.
The big idea
The fastest-growing manufacturers are building moats in three places:
- Factory performance (uptime, yield, throughput)
- Decision speed (how fast the org can plan, respond, and execute)
- Trust (buyers, partners, regulators, employees)
If you improve those three, growth gets easier. If you ignore them, growth becomes expensive.
Strategy Playbook Grid
| Function | Recommendation | What to do (specific moves) | Expected impact | KPIs to track |
|---|---|---|---|---|
| Finance | Use “capability M&A” to compress your roadmap | Acquire or partner for missing capabilities (simulation/digital twin, AI maintenance, MES modernization). Prioritize tuck-ins that integrate cleanly. | Faster time-to-capability; fewer rebuild costs | Integration time; revenue synergy capture; attach rate; gross margin lift |
| Finance | Improve unit economics by designing for expansion revenue | Build pricing and packaging that rewards multi-site rollouts (tiered pricing, site bundles). Push service attach (support, parts, monitoring). | Higher LTV; more predictable revenue | Net revenue retention (NRR); service attach %; expansion ARR; churn |
| Finance | Tighten cash conversion to fund growth internally | Attack working capital: inventory turns, supplier terms, DSO discipline. Treat cash as a production input. | More self-funded capex; lower financial risk | Cash conversion cycle; DSO; inventory turns; free cash flow |
| Marketing | Shift from lead-gen to “proof-gen” | Build a proof library: quantified case studies, ROI calculator, implementation timelines, security/compliance pack, comparison pages. | Higher conversion rates; shorter sales cycles | Website-to-meeting %; win rate; sales cycle length; demo-to-close |
| Marketing | Build an omnichannel buying path that feels effortless | Create a self-serve path: technical content, demo videos, pricing ranges (if possible), partner locator, procurement kit. Reduce friction before sales touches. | More qualified inbound; fewer stalled deals | Organic pipeline; assisted conversions; rep-free funnel progression |
| Marketing | Run account-based plays for high-value factories | Target top accounts with role-specific messaging: plant manager (uptime), engineering (integration), procurement (TCO), finance (payback). Use LinkedIn + webinars + direct mail selectively. | Larger deal sizes; higher enterprise penetration | Engaged accounts; meetings per target account; pipeline per account |
| Operations | Make uptime and yield the operating north star | Start with OEE, scrap, changeover time. Deploy predictive maintenance and machine vision where payback is clear. | Lower downtime; higher throughput; margin lift | OEE; MTBF/MTTR; scrap rate; schedule adherence |
| Operations | Standardize the factory tech stack across sites | Define the “minimum viable stack”: ERP integration rules, MES standard, common SCADA layer, data model. Roll out site-by-site with a playbook. | Faster scaling; lower integration cost | Implementation time per site; data availability; system adoption |
| Operations | Build a workforce engine, not a hiring scramble | Create internal training tracks for controls, robotics techs, maintenance reliability, and data roles. Partner with local schools where needed. | Reduced talent risk; higher productivity | Time-to-fill; retention; training completion; skill coverage ratio |
| Operations | Reduce supply chain fragility with smart redundancy | Dual source critical components, nearshore where lead time matters, digitize supplier performance tracking. | Fewer disruptions; more predictable delivery | OTD; supplier variance; expedite cost %; lead time stability |
Practical “how to start” roadmap (90-day version)
If you are looking at this and thinking “cool, but where do I start,” here’s a tight sequence that works in a real factory.
First 30 Days: Baselines and Pilot Selection
- Pick 1 line or 1 plant where downtime or scrap is painful and measurable
- Lock 5 baseline metrics: OEE, downtime hours, scrap %, schedule adherence, OTD
- Come up with a basic ROI model for that pilot that all members of the finance, operations, and sales teams will live with
Days 31–60: execute the pilot and build the proof asset
- Apply the simplest useful improvement on which to focus (Predictive Maintenance, Vision Inspection, Scheduling Optimization, etc.)
- Document everything
- Turn results into a “proof kit”: a 1-page case study and a plan for implementation
Days 61–90: scale the playbook, not the chaos
- Build a repeatable rollout template for the next site/line
- Standardize the tech decisions (don’t reinvent every time)
- Two internal champions per site (ops and maintenance/controls)
What to prioritize by manufacturing type
Discrete manufacturing (auto parts, electronics, machinery)
Highest payoff: Machine vision quality control, robotics, scheduling optimization, traceability
Process industries (chemicals, food, pharma)
Highest payoff: Reliability programs, predictive maintenance, energy optimization, compliance automation
High-mix, low-volume (job shops, custom fabrication)
Highest payoff: Quoting speed, work instructions, MES-lite visibility, inventory accuracy
Short list of “avoid these traps” (because they’re expensive)
- Buying tech without an adoption plan
- Measuring everything but improving nothing
- Treating data integration as an afterthought
- Over-customizing all sites, so that nothing scales
- Marketing with claims but no proof
8. Appendices & Sources
A) Raw data tables
| Market / layer | Baseline year | Baseline size | Forecast year | Forecast size | CAGR | Primary growth drivers |
|---|---|---|---|---|---|---|
| Global manufacturing (overall) | 2025 | $14.85T | 2032 | $20.76T | 4.9% | Broad industrial demand; capacity upgrades; automation adoption |
| Smart manufacturing (global) | 2026 | $446.45B | 2034 | $1.34T | 14.7% | Industrial IoT; robotics; AI + analytics; predictive maintenance |
| Sustainable manufacturing (global) | 2023 | $203.65B | 2030 | $422.12B | 11.0% | Energy efficiency; waste reduction; compliance pressure; circular inputs |
| Industry 4.0 technologies (global) | 2025 | $655.2B | 2030 | $1.6T | 19.4% | Connectivity + sensors; digital twins; edge computing; factory software layers |
| Buyer | Target | Date (announced / completed) | Deal value | Why it matters | Source |
|---|---|---|---|---|---|
| Synopsys | Ansys | Completed: 2025-07-17 | $35B | Semiconductor design + simulation consolidation; strengthens end-to-end digital engineering workflows | https://www.tomshardware.com/tech-industry/semiconductors/synopsys-acquires-simulation-specialist-ansys-for-usd35-billion-following-chinese-regulator-approval-merger-to-power-end-to-end-design-platform |
| Siemens | Altair Engineering | Completed: 2025 | ~$10B EV | Deepens simulation + AI; reinforces digital twin and industrial software stack | https://press.siemens.com/global/en/pressrelease/siemens-acquires-altair-create-most-complete-ai-powered-portfolio-industrial-software |
| SoftBank Group | ABB Robotics business | Announced: 2025-10-08 (closing expected 2026) | $5.375B | Robotics consolidation; signals robotics as strategic AI-enabled platform layer | https://group.softbank/en/news/press/20251008 |
| Honeywell | Johnson Matthey catalyst technologies | Finalized: 2025 | £1.8B | Process efficiency and yield improvements in chemical manufacturing; energy and throughput impact | https://www.ft.com/content/c150ad9f-8e1e-48ba-bd49-f75fb41b58b8 |
| Honeywell | Sundyne | Announced: 2025-03 | ~$2.16B | Critical equipment + aftermarket services; reliability and energy-transition adjacency | https://www.honeywell.com/us/en/press/2025/03/honeywell-to-acquire-sundyne-to-expand-critical-equipment-portfolio-and-aftermarket-services |
| Qualcomm | Alphawave | Announced: 2025 (closing expected early 2026) | $2.4B | Connectivity/infrastructure silicon for AI-driven data center demand; chip ecosystem investment signal | https://www.ft.com/content/7809d815-0a7f-4c79-8026-18a1ccdf2d2a |
| American Axle & Manufacturing | Dowlais (GKN Automotive, etc.) | Announced: 2025-01 | ~£1.16B | Auto supplier consolidation under EV transition; scale and cost synergy pressure | https://www.ft.com/content/1e5350a7-798b-4a17-9055-cc417af2b225 |
| Vista Equity Partners | Amtech Software | Announced: 2025-06 | Undisclosed | Packaging-focused ERP/MES rollup logic; sticky workflow control layers | https://www2.hl.com/pdf/2025/industrial-software-market-update-fall-2025.pdf |
| Accenture | SYSTEMA | Announced: 2025-07-01 | Undisclosed | Builds semiconductor manufacturing automation delivery capacity (services + execution) | https://newsroom.accenture.com/news/2025/accenture-acquires-systema-to-drive-manufacturing-automation-for-semiconductor-clients |
| ECI Software Solutions | Amper Technologies | Announced: 2025-12-09 | Undisclosed | MES visibility for SMB factories; operational efficiency via real-time data | https://www.amper.co/post/eci-software-solutions-acquires-amper-technologies-increasing-ai-driven-operational-efficiency-for-manufacturers |
| LTV:CAC ratio range | Performance level | What it usually signals | Common situation in manufacturing-related businesses | Operational takeaway |
|---|---|---|---|---|
| < 3:1 | Weak / warning | CAC too high vs value; retention or pricing may be weak | Early-stage industrial SaaS; long cycles; heavy implementation; unclear differentiation | Tighten ICP; improve onboarding; raise retention; simplify sales motion |
| 3:1–5:1 | Healthy / sustainable | Balanced growth economics; manageable payback | Scaling factory software providers with stable contracts | Drive expansion; reduce deployment friction; improve partner contribution |
| 5:1–8:1 | Strong / efficient | High LTV and strong retention; acquisition spend effective | Sticky workflows; multi-site rollouts; strong customer success | Reinvest in growth while protecting retention and CS quality |
| > 8:1 | Very high / possible underinvestment | Exceptional economics or not investing enough in growth | Niche platforms; high switching costs; limited competition | Validate retention strength; consider scaling sales/marketing faster |
| KPI | Typical good target | Why it matters | Notes / variation by subsector |
|---|---|---|---|
| On-time delivery (OTD) | 95%+ | Customer trust; contract penalties; renewal leverage | ETO businesses may accept lower OTD if lead times are long but reliable |
| Inventory turns | 6–12x (typical range) | Cash efficiency; obsolescence risk | Varies widely (electronics higher; heavy equipment lower) |
| Supplier lead-time variance | Low and predictable | Planning accuracy; fewer expedite costs | Variance often matters more than average lead time for critical parts |
| Freight cost as % of COGS | Industry-dependent | Margin leakage; volatility risk | Track trend vs plan; heavy/long-haul products skew higher |
| Production schedule adherence | 90%+ | Operational stability; throughput reliability | High-mix/low-volume targets differ; improvement trend matters |
| OEE (Overall Equipment Effectiveness) | 60–85% (contextual) | Links availability/performance/quality to capacity and cost | Best benchmark is peer group within the same process type |
| Scrap / rework rate | Continuous reduction target | Margin + capacity impact; quality and training signal | Regulated industries may rework more but should track total cost impact |
| Order-to-ship cycle time | Competitive vs peers | Cash conversion + customer satisfaction | Define stages clearly; MTS vs ETO differs dramatically |
| Area | Spend trend (next 5 years) | Primary drivers | Shifting toward | Shifting away from |
|---|---|---|---|---|
| Automation + robotics | Strong increase | Labor gaps; productivity; flexibility | Robotics cells; cobots; machine vision; AMRs/AGVs | Manual repetitive processes; fixed automation without feedback |
| Industrial software (MES, analytics) | Strong increase | Real-time visibility; execution control | MES modernization; OEE/quality analytics; scheduling optimization | Spreadsheets; siloed reporting; disconnected point tools |
| Sustainability + energy optimization | Increase | Compliance; energy cost; customer pressure | Energy monitoring; process redesign; emissions reporting | Reactive compliance; non-instrumented utilities usage |
| Industrial IoT + connectivity | Increase | Instrumentation; interoperability; scalable data capture | Sensors; edge gateways; IIoT platforms; secure connectivity | Manual checks; fragmented data collection |
| OT cybersecurity | Increase | Connected factories; rising attacks; critical infrastructure rules | Segmentation; monitoring; OT zero-trust; incident response | Ad-hoc patching; perimeter-only security |
| Traditional capex only (machines without software) | Flat to declining share | Value shift to intelligent layers | Smart equipment with telemetry + integration | Standalone machines with limited monitoring |
| Workforce training + reskilling | Increase | Skills gaps; aging workforce; automation adoption | Internal academies; controls/robotics/data upskilling | Hiring-only approaches |
| Marketing: digital self-serve (SEO, web, demos) | Increase | Buyer self-serve preference; omnichannel journeys | Technical libraries; ROI tools; virtual demos | Brochures; generic product pages |
| Marketing: events + field marketing | Selective / optimized | Trust value with cost scrutiny | Account-based events; curated briefings | Spray-and-pray event calendars |
| Marketing: partners (OEMs, integrators, distributors) | Increase | Reach; credibility; delivery capacity | Co-marketing; enablement; joint pipeline | Unmanaged partner networks |
B) Hyperlinked source list
Global manufacturing market forecast (size/CAGR)
https://www.coherentmarketinsights.com/industry-reports/global-manufacturing-market
Smart manufacturing market forecast
https://www.fortunebusinessinsights.com/smart-manufacturing-market-103594
Sustainable manufacturing market forecast
https://straitsresearch.com/report/sustainable-manufacturing-market
Industry 4.0 market sizing
https://www.precedenceresearch.com/industry-4-0-market
Industrial manufacturing M&A trends (KPMG)
https://kpmg.com/kpmg-us/content/dam/kpmg/pdf/2025/q2-2025-ma-trends-report.pdf
Industrial automation deal activity report (Blue River)
https://goblueriver.com/wp-content/uploads/2025/08/Industrial-Automation-Q2-2025-Report-.pdf
Synopsys–Ansys deal completion coverage
Siemens–Altair press release
SoftBank–ABB Robotics press release
https://group.softbank/en/news/press/20251008
Honeywell–Sundyne press release
Accenture–SYSTEMA announcement
ECI–Amper announcement
B2B buying preferences (Gartner newsroom)
B2B omnichannel behavior (McKinsey B2B winners article)
Forrester B2B predictions (digital self-serve trend)
https://www.forrester.com/press-newsroom/forrester-predictions-2025-b2b-marketing-sales/
B2B content marketing effectiveness (CMI 2025 research)
https://contentmarketinginstitute.com/b2b-research/b2b-content-marketing-trends-research-2025
Semiconductor revenue growth signal (Gartner newsroom)
Private market dry powder (PitchBook dashboard)
https://pitchbook.com/news/articles/global-private-market-funds-dry-powder-dashboard-2026
PE dry powder (S&P Global Market Intelligence)
SaaS benchmarks (Benchmarkit 2025)
https://www.benchmarkit.ai/2025benchmarks
SaaS benchmarks (High Alpha)
https://www.highalpha.com/saas-benchmarks
EV/EBITDA snapshots (ValueInvesting.io examples)
https://valueinvesting.io/ROK/valuation/ev_ebitda-multiples
https://valueinvesting.io/SIE.DE/valuation/ev_ebitda-multiples
https://valueinvesting.io/SU.PA/valuation/ev_ebitda-multiples
Multiples dataset (Damodaran)
https://pages.stern.nyu.edu/~adamodar/New_Home_Page/datafile/psdata.html
C) Notes on data limitations and methodology
- Forecast ranges vary by source
Note that market sizing and CAGRs are functions of scope definitions-what is included and excluded. - “Forecasted spend” table is directional
Please note that the spend-per-function/channel table represents common budgeting patterns and strategic shifts observed in the report-not a single audited dataset. It is for planning and prioritization purposes, not precision forecasting. - Unit economics are context-sensitive
The LTV:CAC bands are one of the most common SaaS heuristics. Real-world performance does vary with the length of sales cycles, implementation uplifts, churn/NRR, and gross margin. - Multiples change constantly
EV/Revenue and EV/EBITDA are time-sensitive and can swing with rates, earnings, and sector sentiment. Consider them as indicative of market context rather than targets.
Disclaimer: The information on this page is provided by Manufacturing.co for general informational purposes only and does not constitute financial, investment, legal, tax, or professional advice, nor an offer or recommendation to buy or sell any security, instrument, or investment strategy. All content, including statistics, commentary, forecasts, and analyses, is generic in nature, may not be accurate, complete, or current, and should not be relied upon without consulting your own financial, legal, and tax advisers. Investing in financial services, fintech ventures, or related instruments involves significant risks—including market, liquidity, regulatory, business, and technology risks—and may result in the loss of principal. Manufacturing.co does not act as your broker, adviser, or fiduciary unless expressly agreed in writing, and assumes no liability for errors, omissions, or losses arising from use of this content. Any forward-looking statements are inherently uncertain and actual outcomes may differ materially. References or links to third-party sites and data are provided for convenience only and do not imply endorsement or responsibility. Access to this information may be restricted or prohibited in certain jurisdictions, and Manufacturing.co may modify or remove content at any time without notice.