The State of American Manufacturing Market Research Report
1. Industry Overview & Executive Summary
Industry Size, Growth, and Macro Outlook
Market Size & Economic Contribution
- U.S. manufacturing value added: approximately $2.6 trillion (2022), making the U.S. the second-largest manufacturing economy globally, behind China.
- Share of U.S. GDP: 9.5% as of Q3 2025, reflecting a structurally smaller but strategically critical sector.
- Employment: ~12.7 million workers (Dec 2025), down from historical peaks but stable in recent years despite automation gains.
Global context
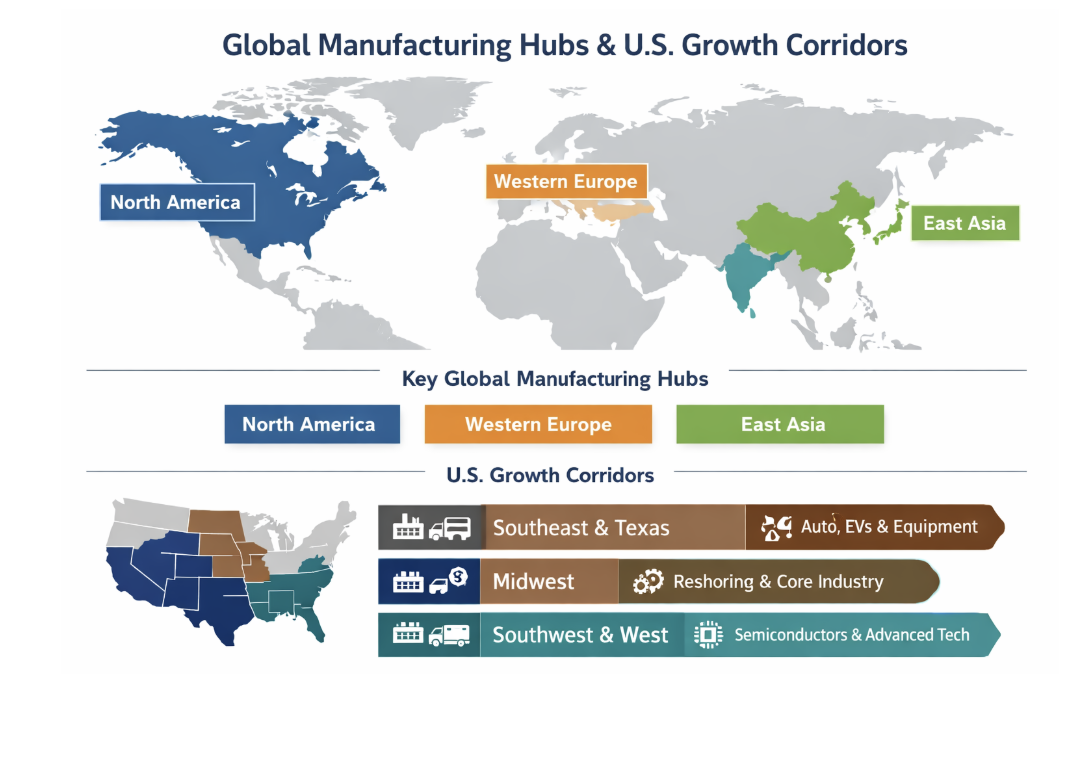
- The U.S. accounts for roughly 15% of global manufacturing value added, compared with China’s ~31%. Manufacturing remains geographically concentrated across East Asia, North America, and Western Europe.
Growth Rate & Cyclicality
- Long-term real CAGR: ~1.5–2.0% over the past two decades (inflation-adjusted).
- Near-term outlook (2025–2027):
- Growth is uneven and subsector-specific, with strength in semiconductors, defense, industrial automation, and electrification.
- Traditional cyclicals (basic metals, some consumer durables) face demand volatility tied to interest rates and inventory normalization.
Current Operating Environment (Late 2025)
- New orders: Declining modestly month-over-month, signaling cautious customer spending.
- Shipments: Flat to slightly positive, supported by backlog fulfillment.
- Backlogs: Elevated unfilled orders-to-shipments ratio (~6.9), indicating lingering capacity and supply chain friction rather than demand collapse.
- Costs: Wage pressure remains persistent, reinforcing the business case for automation and productivity investment.
Macro takeaway:
U.S. manufacturing is in a low-growth but high-strategic-importance phase, with performance driven less by aggregate demand and more by policy, technology adoption, and supply chain reconfiguration.
Key Drivers of Industry Growth
1. Reshoring, Nearshoring, and Industrial Policy
- Reshoring + foreign direct investment (FDI): ~244,000 jobs announced in 2024, primarily across the Southeast, Texas, and Midwest.
- Drivers include:
- Geopolitical risk reduction
- Tariffs and trade uncertainty
- Federal incentives (e.g., CHIPS and related manufacturing grants)
- Momentum remains positive but volatile, with announcement activity sensitive to election cycles and fiscal clarity.
2. Capital Investment in Advanced Manufacturing
- Semiconductors and electronics: Over $630B in announced U.S. semiconductor supply-chain investments, anchoring long-cycle capital deployment.
- Spillover effects:
- Tooling, chemicals, precision components
- Construction and industrial services
- Workforce upskilling and automation demand
3. Automation, Robotics, and Digitalization
- U.S. industrial robot installations: 34,164 units in 2024, the highest in the Americas.
- Key motivations:
- Rising labor costs and skill shortages
- Quality consistency and yield improvement
- Faster changeovers and shorter lead times
- Adoption is shifting from “pilot” use cases to enterprise-wide automation programs.
4. Supply Chain Redesign and Logistics Normalization
- Ocean freight rates have normalized substantially from pandemic highs, enabling:
- Network redesign
- More rational safety stock policies
- Regional distribution strategies
- Manufacturers are prioritizing resilience over pure cost minimization, maintaining some redundancy even as logistics costs ease.
Cross-Functional Executive Summary
Finance Perspective
- Manufacturing remains capital intensive and cyclical, but capital is increasingly allocated toward:
- Automation with short, measurable payback
- M&A that adds recurring or aftermarket revenue
- Assets aligned with defense, energy transition, and industrial software
- Strategic acquirers now dominate M&A value, reflecting long-term operating synergies rather than financial engineering.
Marketing Perspective
- Buying behavior has shifted decisively toward:
- Digital-first research by engineers and operators
- Later-stage engagement with sales
- Effective manufacturers emphasize:
- Proof-based messaging (certifications, uptime, yield)
- Risk reduction (lead times, dual sourcing, compliance)
- Total cost of ownership rather than unit price
Operations Perspective
- Winning operating models share common traits:
- Dual- or multi-sourcing strategies
- Increased automation in material handling, inspection, and scheduling
- Integrated ERP–MES–quality data stacks
- Workforce constraints and wage pressure accelerate the ROI of process improvement and technology adoption.
Industry Snapshot Table
| Metric | Value / Range | Notes / Context | Primary Source |
|---|---|---|---|
| U.S. manufacturing value added (GDP) | ~$2.8 trillion | Represents ~10–11% of total U.S. GDP; reflects value-added, not gross output | BEA |
| Manufacturing gross output | ~$7 trillion | Total shipment value; includes intermediate goods and double-counting across supply chains | U.S. Census (ASM) |
| 5-year CAGR (real terms) | ~1.5–2.5% | Moderate growth constrained by labor availability and capital intensity | Federal Reserve (INDPRO) |
| Total manufacturing employment | ~13 million workers | Employment remains below late-1990s peak but productivity per worker has risen | BLS |
| Average capacity utilization | ~77–79% | Below long-term highs; supports focus on reliability over maximum throughput | Federal Reserve (TCU) |
| Capital expenditure trend | Stable to modest growth | Capex increasingly targeted at automation, reliability, and compliance rather than expansion | Deloitte |
| Primary growth drivers | Automation, reshoring, energy transition, defense | Growth concentrated in subsectors with policy, security, or productivity tailwinds | McKinsey |
| Key structural constraints | Labor shortages, compliance costs, capex ROI pressure | These constraints shape both operational and investment decision-making | BCG |
Global Hubs or Growth Geographies Map
2. Finance & Investment Landscape
Scope note: “American manufacturing” spans many subsectors (process vs. discrete, OEM vs. supplier, recurring vs. project revenue). Financial profiles vary dramatically; treat benchmarks as segmenting tools, not universal truths.
Recent M&A Activity
Deal climate & what’s driving it
- Strategic buyers are leading more of the value in industrial manufacturing M&A (vs. purely financial buyers), reflecting a focus on operating synergies, portfolio resilience, and capability acquisition (automation, aftermarket/service, filtration, software/simulation). (KPMG)
- Reported industrial manufacturing activity in 2025 shows volume softness but large strategic transactions still clearing when they fit long-term platform theses.
Major themes
- Aftermarket / service mix expansion (more stable cash flows through cycles)
- Automation & industrial tech (robotics, simulation, digital engineering)
- Aerospace/defense consolidation (certification, parts/IP, installed base)
- Supply-chain resilience (capacity, critical components, filtration, logistics)
Deal Table (Selected, disclosed values)
| Buyer | Seller / Asset | Amount | Date | Strategic Rationale | Source |
|---|---|---|---|---|---|
| Parker Hannifin | Filtration Group | $9.25B | Nov 11, 2025 | Expand filtration platform; scale synergies; strengthen higher-value end-market exposure. | Parker investor release |
| SoftBank Group | ABB Robotics (carve-out) | $5.375B | Oct 8, 2025 | Build a robotics platform positioned for AI-driven automation demand and global scale. | SoftBank press release |
| TransDigm | Jet Parts Engineering + Victor Sierra Aviation | $2.2B | Jan 16, 2026 | Consolidation in aerospace aftermarket components; expand parts portfolio and installed-base monetization. | AeroTime coverage Media |
Investment Trends (PE/VC, IPOs, and “dry powder” behavior)
PE posture
- In industrial manufacturing, the recent pattern is more selective PE participation and heavier reliance on strategic buyers for large-value deals (per KPMG’s sector read). (S&P Global, PitchBook)
“Industrial services + automation” deal velocity
- Industrial-services deal flow has been comparatively active (often adjacent to manufacturing operations and modernization), with reported deal volumes and valuation summaries tracked by industry deal monitors. (KPMG Assets, WilmerHale)
IPOs
- IPO windows for cyclical industrials tend to be narrow and rate-sensitive; in this environment, public market listings are generally more feasible for companies with recurring revenue, clear secular tailwinds, and strong margins (e.g., industrial software, specialized services). (KPMG, StockAnalysis, Barron’s)
Revenue Models & Unit Economics (How money is made)
A. Discrete manufacturers (equipment, components, auto/aero suppliers)
Core unit economics drivers
- Utilization / OEE → absorbs fixed costs
- Yield, scrap, rework → direct margin impact
- Warranty / returns → delayed margin leakage
- Working capital (inventory + receivables) → cash conversion cycle
Labor cost baseline (macro input):
- Average hourly earnings in manufacturing: $36.07/hr (Dec 2025).
B. Process manufacturers (chemicals, food, pharma intermediates)
Core unit economics drivers
- Feedstock spread (input vs output prices)
- Downtime (high penalty)
- Quality/regulatory compliance cost (cost of nonconformance)
C. “Manufacturing-adjacent recurring” (parts, service, distribution, industrial SaaS)
Core unit economics drivers
- Attach rate (service/parts on installed base)
- Retention + expansion
- Gross margin (service often higher than equipment)
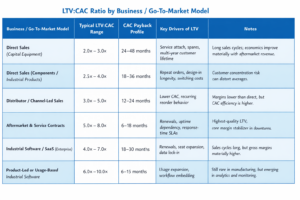
- Sales efficiency (CAC payback; LTV expansion)
LTV:CAC Ratio Chart
EV/Revenue + EV/EBITDA Multiples
| Metric | Reported Value | Sample / Context | Source |
|---|---|---|---|
| EV/EBITDA (Median) | ~8.4x | Reported strategic deals, 1H 2025 (industrial services scope). | R.L. Hulett — Industrial Services (deal monitor) |
| EV/Revenue (Median) | ~1.6x | Reported PE deals, 1H 2025 (industrial services scope). | R.L. Hulett — Industrial Services (deal monitor) |
Interpretation
Higher recurring/service mix and defensible niches typically support higher multiples; commodity-like and highly cyclical profiles tend to compress. Replace these figures with segment-specific comps for your target vertical (e.g., automation, aerospace suppliers, process industries).
3. Marketing Performance & Trends
Channel Breakdown (SEO, paid, influencer, email, events)
What manufacturing marketers actually use—and what they say works
Content Marketing Institute’s 2025 manufacturing outlook (survey published Nov 20, 2024) provides one of the clearest channel-level cuts for the sector: (Content Marketing Institute)
Owned / organic distribution (usage vs. “most effective”)
- Organic social: used by 95% of manufacturing marketers; rated effective by 39% (Content Marketing Institute)
- Corporate blog/website: used by 76%; rated effective by 49% (Content Marketing Institute)
- In-person events: used by 71%; rated effective by 51% (highest) (Content Marketing Institute)
- Webinars: used by 42%; rated effective by 49% (Content Marketing Institute)
- Email newsletters: used by 64%; rated effective by 40% (Content Marketing Institute)
- Email (non-newsletter): used by 62%; rated effective by 45% (Content Marketing Institute)
Paid channels (usage vs. “best results”)
- 92% used paid channels in the last 12 months (Content Marketing Institute)
- Within paid, SEM/PPC is both heavily used (70%) and most often cited as producing best results (68%) (Content Marketing Institute)
- Sponsorships (events/booths/workshops): cited for best results by 48% (Content Marketing Institute)
- Social ads/promoted posts: cited for best results by 42% (Content Marketing Institute)
- “Influencer marketing” appears, but remains niche (19% usage) (Content Marketing Institute)
Platform signal (organic social “best value”)
- Manufacturing marketers most often say LinkedIn delivers the best value (85%), followed by YouTube (40%)—consistent with the sector’s technical content needs and video effectiveness. (Content Marketing Institute)
Multi-Channel Performance Table
| Channel | Usage (last 12 months) | Most effective / best results | Practical implication for ROI |
|---|---|---|---|
| In-person events | 71% | 51% | Highest-perceived effectiveness; strong for late-stage validation and relationship building. |
| Corporate blog / website | 76% | 49% | Compounding ROI via technical SEO and self-serve research; supports sales-cycle compression. |
| Webinars | 42% | 49% | High leverage for complex products; effective mid-funnel “education → intent” bridge. |
| Email (non-newsletter) | 62% | 45% | Best for nurture and expansion (service, parts, upgrades) with segmentation and SLA’d follow-up. |
| Email newsletters | 64% | 40% | Reliable for reactivation and product updates; ROI improves with role-based personalization. |
| Organic social | 95% | 39% | Best as distribution and credibility layer; convert via retargeting and strong proof assets. |
| Paid search (SEM / PPC) | 70% (among paid users) | 68% (best paid results) | Captures high-intent demand (“spec/quote/replacement”); strongest when paired with fast-quote flows. |
| Sponsorships | 60% (among paid users) | 48% (best paid results) | Works when aligned to niche audiences (trade media, associations, events) and tracked to pipeline. |
| Social ads / promoted posts | 66% (among paid users) | 42% (best paid results) | Often strongest for retargeting and event amplification; requires proof assets to convert. |
| Influencer marketing | 19% (among paid users) | — | Typically SME/creator-engineer partnerships; best for credibility and top-funnel trust, not volume conversion. |
Cross-channel cost reality check: Search advertising costs increased YoY for most industries, though CPL increases were milder in WordStream’s Apr 2024–Mar 2025 dataset; they report an overall avg CPC ~$5.26 and avg CPL ~$70.11 (all industries). Treat these as directional—industrial terms often skew higher where competition is intense and lead value is high. (WordStream)
Buyer Behavior Trends (Demographics, psychographics, decision triggers)
The “rep-free” preference is now explicit
- Gartner reports 61% of B2B buyers prefer an overall rep-free buying experience (survey cited in its June 25, 2025 press release). (Gartner)
- McKinsey’s 2024 B2B Pulse research describes persistent omnichannel preferences (“ability to interact in many ways… at any time”) and segments decision makers into archetypes (Adapters / Innovators / Seekers). (McKinsey & Company)
- Forrester predicts more than half of large B2B purchases (≥$1M) will be processed through digital self-serve channels (website or marketplace). (Forrester)
Manufacturing-specific buying triggers (what reliably moves deals)
Technical & risk triggers (most common):
- Downtime risk (uptime, MTBF, service response time)
- Lead time certainty (delivery reliability, regional inventory, alternates)
- Quality & compliance (certifications, traceability, PPAP/FAI, audits)
- Total cost of ownership (energy, consumables, maintenance, scrap reduction)
- Proof in similar environments (case studies tied to plant type/process)
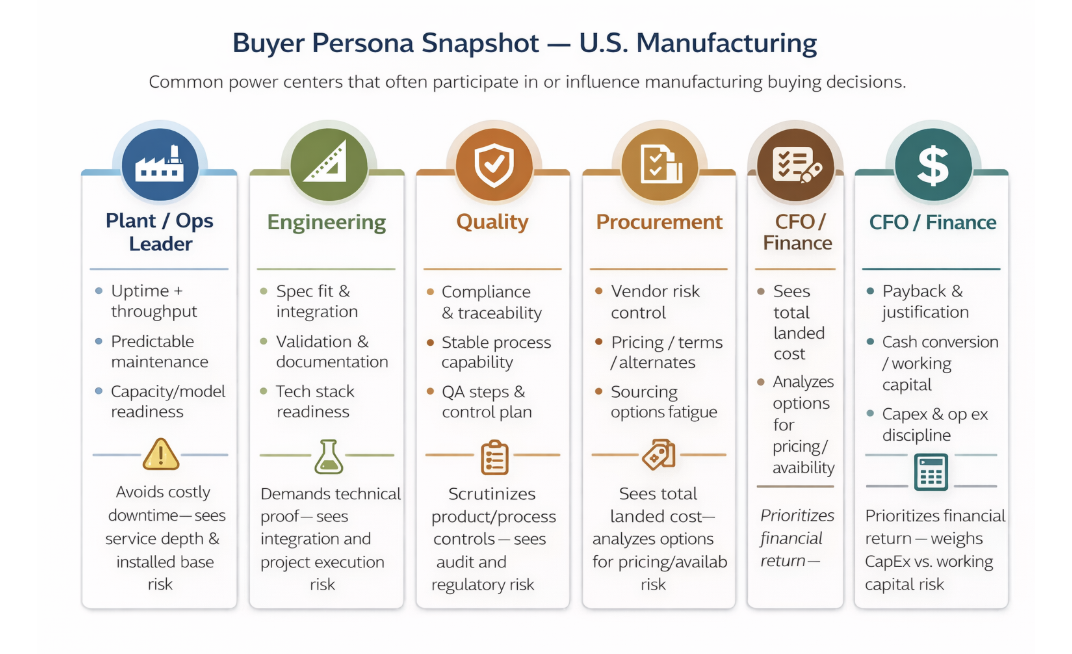
Buying-committee reality: even when procurement signs, manufacturing purchases are typically “co-signed” by engineering, operations/maintenance, quality, and finance—each with different evidence standards.
Creative & Messaging That Performs Best
CMI’s manufacturing findings strongly suggest the sector responds to high-clarity, high-evidence content:
- Top content types used: short articles/posts (89%) and videos (85%) (Content Marketing Institute)
- Most effective content type: video (74%), followed by case studies/customer stories (45%) and white papers (43%) (Content Marketing Institute)
- Manufacturing marketers often cite strategy underperformance because it’s not tied to the customer journey (47%) or not data-driven (46%)—which usually manifests as “content without conversion architecture.” (Content Marketing Institute)
Message frameworks that tend to win in manufacturing
- Outcome + evidence: “Reduce changeover time by X%” + method + proof
- Risk reduction: lead-time guarantees, dual-sourcing, certifications, QA steps
- Operator empathy: “Designed for maintainability” (tool-less access, modular parts)
- Lifecycle economics: ROI calculators, energy savings, scrap reduction, warranty cost
- Implementation clarity: onboarding steps, commissioning timeline, service model
Market Positioning & Brand Perception Shifts
The positioning shift: “product features” → “systems outcomes”
Manufacturing brands are increasingly differentiating through:
- Service + support promise (response times, spare parts availability, field tech coverage)
- Reliability brand (quality systems, traceability, documented processes)
- Integration story (how it fits with ERP/MES/SCADA, interoperability, data readiness)
- Talent & knowledge (application engineering as a “brand asset”)
AI adoption in marketing (manufacturing is cautious by design)
- 76% of manufacturing marketers report using generative AI tools, but only 7% say AI is integrated into daily workflows; 51% experiment ad hoc. (Content Marketing Institute)
Implication: most teams are still in “tool trial” rather than “process redesign,” especially given IP and accuracy concerns.
Persona Snapshot
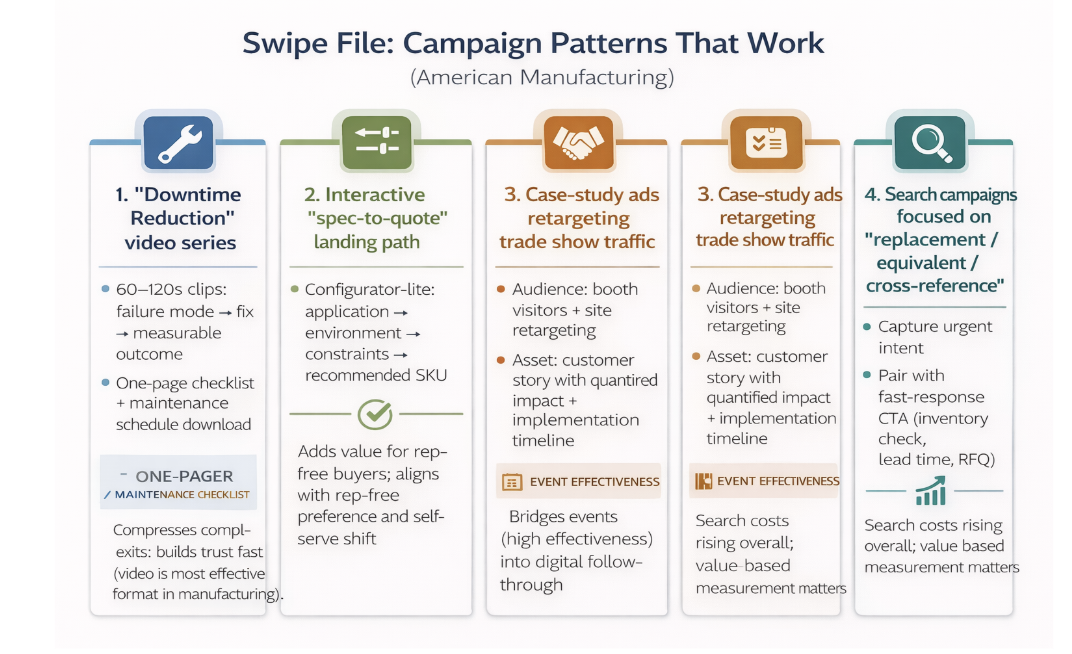
Swipe File: Campaign Examples
4. Operational Benchmarking
Supply Chain & Logistics (costs, delays, nearshoring trends)
The operating reality
U.S. manufacturers are managing two simultaneous logistics regimes:
- “Normalized” transportation markets vs. 2021–2022 extremes (more predictable freight rates and capacity), and
- Higher structural uncertainty from geopolitics, trade policy, and supplier concentration—driving permanent changes in network design.
What best-in-class operators are doing
- Network redesign: shifting from single “lowest-cost” networks to resilient networks (dual ports, dual DCs, multi-carrier contracting, more regional inventory). (Fred)
- Nearshoring + regionalization: not a full reversal of globalization—more like a risk-weighted rebalancing (critical components closer; commoditized inputs still global). (Deloitte)
- Supplier risk segmentation: “A suppliers” get deep partnerships and visibility; “B/C suppliers” get standardized terms, alternates, and buffers.
Logistics benchmarking (what to measure)
| Ops lever | Benchmarking KPI | Why it matters |
|---|---|---|
| Service level | OTIF / fill rate | Direct driver of customer retention, penalties avoidance, and credibility of promise dates. |
| Speed | Dock-to-stock, order cycle time | Reveals execution friction, receiving/putaway efficiency, and planning accuracy. |
| Cost | Freight % of COGS, expedite spend | Captures volatility and forecasting failures that create premium freight and margin leakage. |
| Reliability | Supplier on-time, supplier PPM | Predicts line stoppages, quality escapes, and warranty or rework exposure. |
| Resilience | Single-source % of critical SKUs | Quantifies fragility and recovery time when a supplier, lane, or site goes down. |
Tip
For benchmarking, define KPI targets by customer segment (A/B/C) and attach cost-of-failure (expedite, downtime, penalties) to prioritize improvements.
Workforce Structure (team sizes, hiring patterns, remote vs. in-house)
Workforce constraints are now structural
The biggest operational constraint for many plants isn’t demand—it’s skills availability and execution capacity:
- Maintenance techs, controls engineers, quality specialists, machinists, and planners are persistent bottlenecks. (BLS)
- Wage pressure increases the ROI of automation, training acceleration, and standard work.
What strong workforce models look like
- “Core + flex” staffing: stable core teams plus flexible labor for peaks, while protecting quality-critical operations from churn.
- Skill-based progression: standardized role ladders for operators/techs tied to training modules and certs.
- Remote where it works: planning, procurement, and parts of quality/engineering can be hybrid; hands-on execution remains plant-centric. (BCG)
Workforce benchmarking KPIs
| Area | KPI | Practical target behavior |
|---|---|---|
| Stability | Turnover (monthly / annual) | Reduce volatility in skilled roles; protect critical stations from churn-driven quality drift. |
| Capability | Training hours per FTE; time-to-competency | Shorten ramp time with structured skill ladders; validate proficiency before independent operation. |
| Maintenance | PM compliance; MTTR | Increase preventive discipline and reduce repair time; fewer catastrophic failures and emergency overtime. |
| Productivity | OEE; labor hours per unit | Sustained efficiency gains without sacrificing safety or quality; reduce rework and micro-stoppages. |
| Safety | TRIR; near-miss reporting rate | Aim for “high reporting + declining incidents” to indicate a learning culture and hazard removal. |
Tip
Pair each KPI with an owner (Ops, HR, EHS, Maintenance, Quality) and a weekly cadence. Use role-based dashboards to avoid averaging away the real constraints (e.g., controls techs vs. general operators).
Tech Stack Benchmarking (CRMs, ERPs, MES, AI tools)
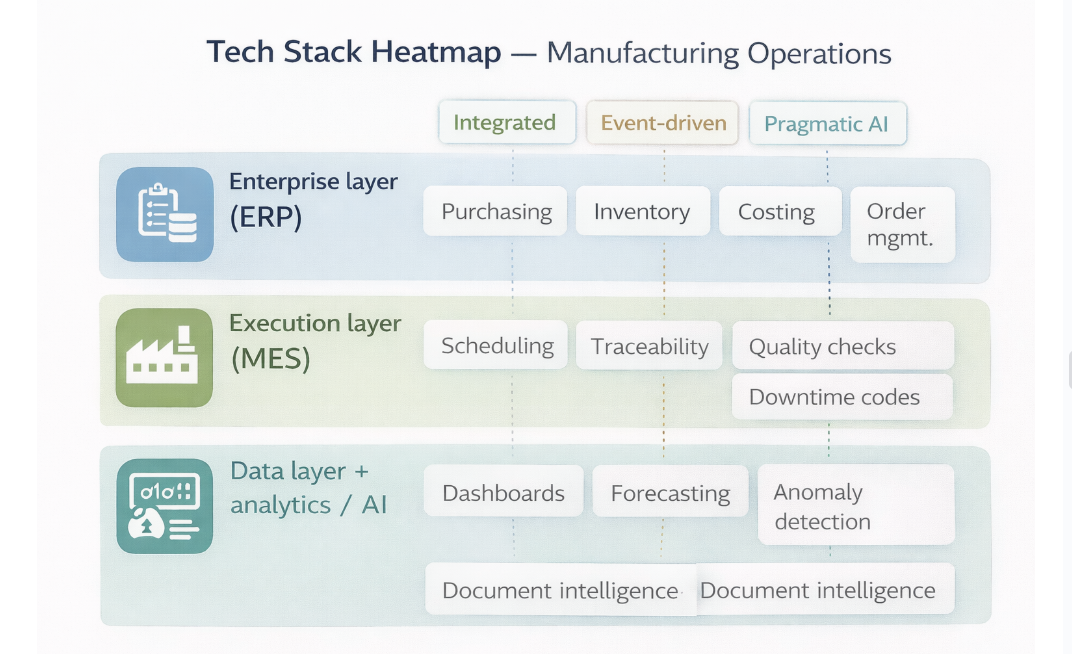
Stack pattern: enterprise layer → execution layer → data/AI layer
Most mature manufacturers converge on a three-layer model:
- ERP (planning + finance): purchasing, inventory, costing, order management (Gartner)
- MES / shop-floor systems (execution): scheduling, traceability, quality checks, downtime codes (World Economic Forum)
- Data layer + analytics/AI: dashboards, forecasting, anomaly detection, document intelligence (McKinsey & Company)
What “best practice” looks like in 2026
- Integration-first: operators are moving away from isolated pilots toward clean master data, consistent part definitions, and integrated workflows.
- Event-driven visibility: automatic status changes (machine events, scans, QA holds) feeding planning and customer commitments.
- Pragmatic AI: focus on repeatable use cases (quality inspection, predictive maintenance signals, quoting support, customer-service triage) rather than broad “AI everywhere.”
Common failure modes
- “ERP installed but not adopted” (shadow spreadsheets remain the system of truth)
- MES not connected to quality/compliance reporting (traceability gaps)
- Analytics built on inconsistent data definitions (dashboards without trust)
Fulfillment & Customer Service Strategies
Fulfillment models in practice
- Make-to-stock (MTS): higher inventory, faster ship, needs strong forecasting and SKU rationalization
- Make-to-order (MTO): lower inventory, longer lead times, needs strong capacity planning and promise-date accuracy
- Configure-to-order (CTO): common for equipment—needs configuration governance and quote-to-cash discipline
2026 best practice: tie promise dates to real capacity, not aspirational lead times—customers will accept longer lead times if they’re reliable.
Service and support (competitive differentiator)
Industrial buyers often judge you on what happens after installation:
- Spare parts availability and response times
- Field service coverage and escalation protocols
- Warranty clarity and root-cause closure loops
Ops KPIs Table
| Function | KPI | Why it matters |
|---|---|---|
| Fulfillment | Perfect order rate; OTIF | Combines accuracy and timeliness; directly affects retention, penalties, and trust in promise dates. |
| Planning | Forecast accuracy; schedule adherence | Predicts expedite costs, missed ship dates, and production instability from poor sequencing or capacity assumptions. |
| Service | First response time; first-time fix rate | Drives uptime outcomes and customer trust; reduces repeat visits, warranty leakage, and escalation burden. |
| Quality | First-pass yield (FPY); returns/warranty rate | Protects margin and reputation; early quality control reduces rework, scrap, and downstream customer failures. |
Tip
To make this actionable, define KPI targets by customer tier and product family, then attach each KPI to a weekly “root-cause & countermeasure” cadence (not just reporting).
Regulatory / Compliance Hurdles (practical, cross-sector)
While specific requirements vary by subsector, common operational burdens include:
- Traceability + documentation (especially aerospace/defense, medical, food, automotive)
- Workplace safety and environmental compliance
- Trade and sourcing rules that affect supplier qualification and landed cost
Operational implication: compliance is not a “back office” function—it shapes system design (MES/QA), supplier onboarding, and customer SLAs.
Tech Stack Heatmap
5. Competitor & Market Landscape
Market Structure & Concentration
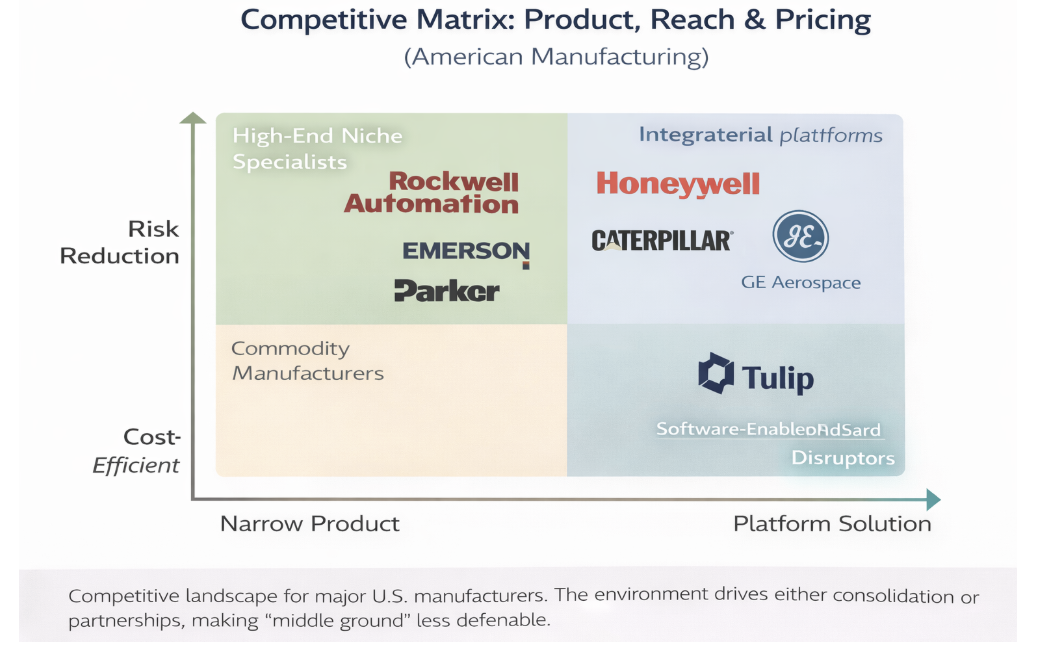
American manufacturing is highly fragmented at the product level but concentrated at the platform level. No single firm dominates the entire sector; instead, leadership emerges within narrow verticals or capability domains (e.g., motion control, automation, aerospace components, industrial gases).
Structural pattern
- Large diversified platforms anchor the ecosystem, offering breadth, balance-sheet strength, and global reach.
- Mid-sized specialists compete on engineering depth, speed, and application expertise.
- Small innovators and startups target bottlenecks (software, sensing, robotics, materials, AI-enabled quality) rather than end-to-end manufacturing.
This structure creates persistent M&A gravity, where scale players acquire niche capabilities rather than build them organically.
Top Players & Strategic Positioning
Below is a representative landscape of major U.S.-centric or U.S.-exposed manufacturing leaders. Market share is shown within their primary domains, not across total manufacturing.
| Company | Primary focus | Strategic positioning | Competitive advantage |
|---|---|---|---|
| GE Aerospace | Aerospace systems | High-complexity, regulated manufacturing with service-linked lifecycle economics. | Installed base, certifications, and long-cycle services revenue. |
| Honeywell | Industrial automation, aerospace, safety | Integrated systems approach combining hardware, software, and services across verticals. | Scale, diversified portfolio, digital capabilities, and service attach. |
| Parker Hannifin | Motion & control technologies | Engineered components plus expansion into higher-value platforms (e.g., filtration). | Sticky customer relationships, broad end-market exposure, and aftermarket leverage. |
| Caterpillar | Heavy equipment | Equipment-led ecosystem with strong services, parts, and dealer-distribution model. | Dealer network, parts/service moat, and global field support. |
| Rockwell Automation | Industrial automation | Factory digitalization platform centered on controls, software, and ecosystem partnerships. | High switching costs, deep installed base, and integrated automation stack. |
| Emerson | Process automation | Mission-critical control and reliability positioning for process industries. | Reliability reputation, switching costs, and embedded plant control footprint. |
Key insight:
Leaders increasingly compete on systems outcomes (uptime, yield, safety, lifecycle cost), not discrete products.
Emerging Players & Disruptors
Where disruption is actually happening
Disruption in manufacturing rarely comes from “full-stack challengers.” Instead, it concentrates in enabling layers that improve productivity, flexibility, or insight.
High-activity disruption zones
- Industrial software & AI
- Predictive maintenance
- Quality inspection (computer vision)
- Scheduling and planning optimization
- Robotics & automation
- Collaborative robots (cobots)
- Autonomous material handling
- Advanced materials & components
- Lightweight composites
- High-performance coatings
- Supply chain visibility
- Supplier risk intelligence
- Traceability and compliance automation
These companies often sell into manufacturers rather than replacing them, which makes them frequent acquisition targets.
Competitive Differentiation Levers
Across subsectors, competitors tend to differentiate on a consistent set of dimensions:
1. Product vs. Platform
- Product players: Compete on specs, price, and delivery.
- Platform players: Bundle hardware + software + service into recurring relationships.
2. Speed vs. Scale
- Smaller firms: Faster customization, shorter decision loops.
- Larger firms: Global availability, redundancy, and financial stability.
3. Cost vs. Risk Reduction
- Low-cost providers compete on unit economics.
- Premium providers compete on risk avoidance (downtime, compliance failure, supply disruption).
4. Recurring Revenue Mix
- Higher service, parts, and software mix → higher valuation resilience.
- Pure equipment revenue → higher cyclicality.
Competitive Matrix (Product vs. Reach vs. Pricing)
SWOT-Style Summary of Top 5 Players
| Player archetype | Strengths | Weaknesses | Opportunities | Threats |
|---|---|---|---|---|
| Diversified industrial conglomerates | Scale, balance-sheet strength, customer trust, global footprint. | Operational complexity, slower innovation cycles, internal silos. | AI-enabled services, portfolio optimization, outcome-based contracts. | Agile specialists, execution drag, activist pressure. |
| Automation & controls leaders | High switching costs, installed base, software leverage. | Long sales cycles, exposure to capex slowdowns. | Factory digitalization, reshoring, services and software expansion. | Open standards, lower-cost competitors, IT/OT convergence risk. |
| Equipment OEMs | Installed base, brand recognition, dealer or distributor networks. | Cyclicality, working-capital intensity, pricing pressure. | Aftermarket growth, service contracts, telematics and monitoring. | Used-equipment markets, alternative financing, demand volatility. |
| Specialized component suppliers | Engineering depth, certification barriers, application expertise. | Customer concentration, design-in/design-out risk. | Platform acquisitions, service attach, premium niches. | Customer consolidation, sourcing pressure, commoditization. |
| Industrial tech startups | Speed, focused innovation, modern software and AI capabilities. | Long enterprise sales cycles, limited balance sheets. | OEM partnerships, acquisition exits, brownfield modernization. | Budget freezes, integration friction, proof-of-scale challenges. |
Interpretation:
Competitive advantage increasingly accrues to players that combine scale or specialization with services, data ownership, and operational risk reduction.
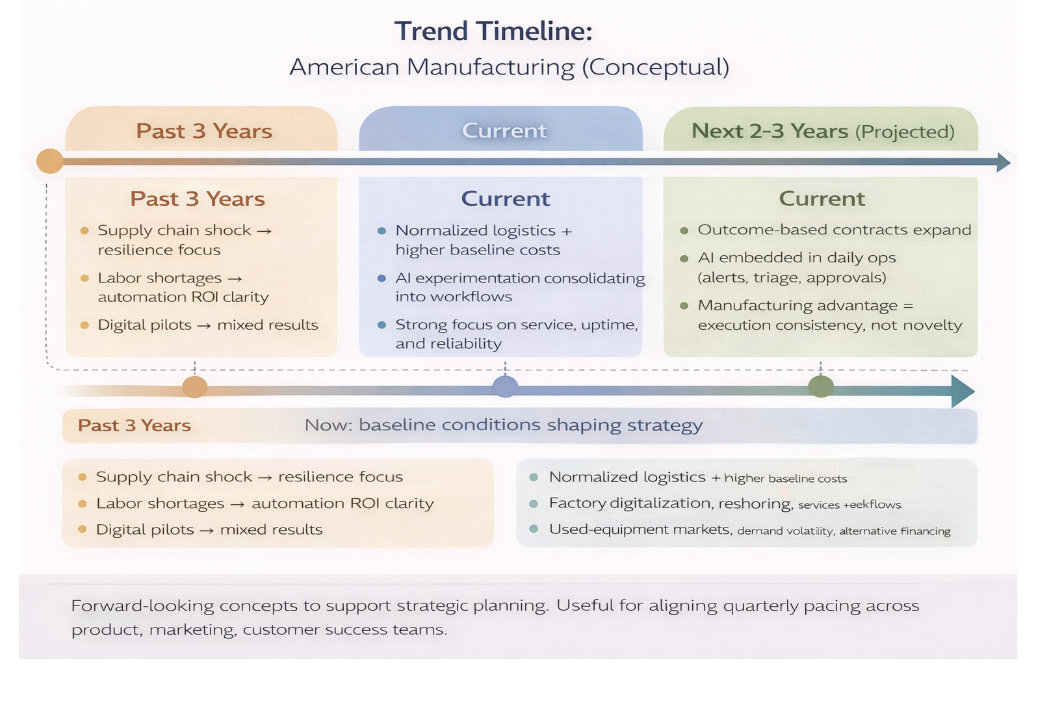
6. Trend Analysis & Forward Outlook
Macroeconomic Factors Shaping Strategy
Interest rates & capital discipline
- Higher-for-longer rates have structurally changed capital allocation behavior. Manufacturers are prioritizing:
- Faster payback periods
- Asset utilization over greenfield expansion
- Incremental automation rather than full-line rebuilds
- Result: ROI scrutiny has intensified, especially for capex-heavy projects (new plants, major equipment refreshes).
Implication: Projects that clearly reduce downtime, labor dependency, or working capital are funded first; “nice-to-have” digital initiatives stall without hard metrics.
Inflation & cost structure normalization
- Input-cost inflation has moderated compared to 2021–2022, but labor, insurance, and compliance costs remain structurally higher.
- Freight markets are more predictable, yet firms are less willing to re-optimize purely for cost after recent shocks.
Implication: Margin protection increasingly comes from operational efficiency and service revenue, not supplier price concessions.
Industrial policy & regulation
- U.S. policy emphasis (semiconductors, energy transition, defense, infrastructure) continues to:
- Pull manufacturing capacity onshore or nearshore
- Increase compliance, reporting, and traceability requirements
- Regulatory complexity disproportionately affects small and mid-sized manufacturers, widening the gap with scaled players.
Implication: Compliance capability itself is becoming a competitive advantage and acquisition rationale.
Technology Disruptions (What’s Real vs. What’s Hype)
Automation & robotics: steady, not explosive
- Adoption is accelerating, but incrementally:
- Cobots, material handling automation, and vision systems lead
- Fully autonomous factories remain rare outside greenfield sites
- Constraint is less technology readiness and more integration + workforce capability.
Near-term winners: automation that reduces reliance on scarce labor and simplifies training.
AI in manufacturing: moving from pilots to workflows
The AI narrative is shifting from experimentation to embedded use cases:
- Quality: computer vision for defect detection, SPC drift alerts
- Maintenance: anomaly detection rather than full predictive overhaul
- Commercial ops: quoting support, document extraction, service triage
Key trend: AI value correlates strongly with data cleanliness and process discipline—not model sophistication.
Digital twins & simulation
- Increasing use in planning, layout design, and commissioning, especially for:
- Complex lines
- Regulated industries
- Still limited in brownfield plants due to data gaps.
Implication: Digital twins are becoming a planning tool first, optimization tool second.
Customer & Buyer Sentiment Trends
Risk aversion over lowest cost
Industrial buyers increasingly prioritize:
- Delivery reliability
- Service responsiveness
- Supplier continuity
over marginal price savings.
Net effect: Value-based selling outperforms discounting in most B2B manufacturing contexts.
Rep-free research, selective human interaction
- Buyers want to self-educate digitally, then engage experts only at:
- Validation
- Exception handling
- Final negotiation
- Sales teams are being restructured toward technical specialists + fewer generalists.
Longer decision cycles, fewer suppliers
- Customers are rationalizing supplier bases to:
- Reduce risk
- Simplify compliance
- Improve accountability
- This favors suppliers that can offer broader coverage or deeper integration.
Predicted Strategic Moves (Finance, Marketing, Operations)
Finance
- Continued bolt-on M&A targeting:
- Software
- Services
- Specialized components
- Divestiture of non-core, low-margin product lines
- Increased focus on recurring revenue mix as a valuation stabilizer
Marketing
- Shift from broad awareness to proof-driven demand generation
- More spend on:
- Search capturing urgent intent
- Case studies tied to quantified outcomes
- Vertical-specific messaging
- Less tolerance for vanity metrics; pipeline attribution becomes mandatory
Operations
- More investment in:
- Workforce training systems
- Preventive maintenance discipline
- Integrated ERP–MES–quality workflows
- Less appetite for “big bang” transformations; modular improvement wins
Trend Timeline
Forecasted Spend per Channel / Function
| Channel | Current typical range | Forecasted range | Directional trend | Rationale |
|---|---|---|---|---|
| Paid Search (SEM / PPC) | 18–22% | 22–28% | ↑ Increase | Captures high-intent demand (replacement, RFQ, spec searches); strongest attribution to pipeline. |
| Content & SEO | 20–25% | 24–30% | ↑ Increase | Self-serve research dominance; compounding ROI and lower blended CAC. |
| Events & Trade Shows | 15–20% | 14–18% | → Flat / slight ↓ | Still effective, but increasingly scrutinized for ROI and post-event conversion. |
| Email & Marketing Automation | 8–12% | 10–14% | ↑ Increase | Nurture, expansion, service revenue, and installed-base monetization. |
| Paid Social / Display | 8–12% | 7–10% | ↓ Decrease | More effective for retargeting than net-new demand; requires strong proof assets. |
| Video (Owned + Paid) | 5–8% | 8–12% | ↑ Increase | High-performing format for technical proof and education; boosts conversion when reused across channels. |
| Influencer / SME Partnerships | 1–3% | 2–4% | ↑ Modest | Credibility-building with engineers/operators; best for trust and top-funnel, not volume acquisition. |
| Marketing Ops / Analytics | 5–8% | 8–12% | ↑ Increase | Attribution, CRM hygiene, and pipeline accountability becoming mandatory. |
Operations & Technology Spend Allocation (% of total ops / digital budget)
| Function | Current typical range | Forecasted range | Directional trend | Rationale |
|---|---|---|---|---|
| Workforce Training & Enablement | 12–16% | 16–22% | ↑ Increase | Skills shortages are structural; fastest ROI lever for throughput and quality stability. |
| Automation & Robotics | 18–25% | 20–28% | ↑ Increase | Labor substitution, safety improvements, and throughput stability under wage pressure. |
| ERP / Core Systems | 15–20% | 14–18% | → Flat | Shift from replacement to optimization and integration; master-data hygiene becomes priority. |
| MES / Shop-Floor Systems | 10–15% | 14–20% | ↑ Increase | Traceability, scheduling discipline, and compliance pressure drive adoption and expansion. |
| Data, Analytics & AI | 5–8% | 10–16% | ↑ Significant | Move from pilots to embedded workflows (quality, maintenance, service triage, document extraction). |
| Maintenance & Reliability Tech | 8–12% | 10–14% | ↑ Increase | Preventive discipline and uptime protection; reduces emergency overtime and catastrophic downtime. |
| Cybersecurity & OT Security | 4–6% | 6–9% | ↑ Increase | Growing OT exposure, regulatory pressure, and customer requirements (vendor risk management). |
| Legacy IT / Misc. Tools | 6–10% | 3–6% | ↓ Decrease | Spend consolidates toward fewer integrated platforms; reduces tool sprawl. |
Finance & Corporate Investment Focus (Qualitative Trend)
| Area | Spend trend | Strategic intent |
|---|---|---|
| Bolt-on M&A | ↑ Increase | Acquire software, services, and niche capabilities to expand recurring mix and de-risk offerings. |
| Organic Capex (Greenfield) | → Flat | Selective, ROI-gated expansions; favor phased projects over “big bang” builds. |
| Service & Aftermarket | ↑ Increase | Margin stability and recurring revenue; strengthens customer stickiness across cycles. |
| Working Capital Optimization | ↑ Increase | Cash discipline under higher rates; inventory turns and receivables are value levers. |
| Divestitures | ↑ Increase | Exit low-margin, non-core lines to simplify portfolios and raise ROIC. |
7. Strategic Recommendations
These recommendations are operational and commercial best practices based on observed manufacturing buying behavior (self-serve research + selective expert engagement), channel effectiveness patterns (events + search + proof content), and the operating shift toward resilience, workforce capability, and workflow AI. They are not investment advice.
Strategy Playbook Grid (Finance × Marketing × Operations)
| Function | Recommendation | Why now (data/logic) | KPI impact (how to measure) | 90-day starting moves |
|---|---|---|---|---|
| Finance | Rebalance growth toward recurring + service attach | Cyclicality is structurally high; buyers value uptime + response. Recurring mix stabilizes planning and margins. |
Service attach rate; gross margin %
Renewal %; % revenue recurring
|
Identify top 20 installed-base accounts and renewal windows
Bundle service tiers into quotes (default option)
|
| Finance | Run a working-capital war room tied to reliability | Inventory buffers protect service levels but can destroy cash. The win is predictable lead times + turns, not one-time cuts. |
Inventory turns; DIO
Expedite spend; OTIF
|
Segment SKUs (A/B/C) and set buffer policies
Fix lead-time + MOQ master data; enforce discipline
|
| Finance | Gate capex using a downtime/labor ROI model | Higher rates demand faster payback; best-funded projects reduce labor dependence or downtime risk. |
OEE; MTTR; labor hours/unit
Scrap rate; payback months
|
Standardize ROI template + baseline measurement
Require post-implementation audit at 60–90 days
|
| Marketing | Prioritize high-intent search + “spec-to-quote” paths | Buyers self-educate, then want fast validation. High-intent search converts when paired with rapid RFQ response. |
CPL; CQL rate; SQL rate
RFQ conversion; time-to-first-response
|
Build RFQ fast path (minimal fields + attachments)
Publish cross-reference/replacement pages; enforce 24–72h SLA
|
| Marketing | Invest in a proof-first content engine (video + case studies) | Manufacturing buyers demand evidence and internal shareability; technical proof improves conversion across channels. |
Content-assisted pipeline; demo rate
Win rate; sales cycle length
|
Launch “failure mode → fix → outcome” video series
Publish 5 quantified case studies + 1-page proof sheets
|
| Marketing | Make events measurable via retargeting + conversion architecture | Events are high-trust but often leak ROI due to weak follow-through. Close the loop with retargeting + meeting capture. |
Cost per meeting; meeting→SQL
SQL→win; post-event pipeline
|
QR capture + attendee list upload; tag in CRM
Retarget within 48h with case studies + meeting CTA
|
| Operations | Make OTIF the executive metric (tie to planning + suppliers) | Reliability beats speed; customers accept longer lead times if delivery is predictable and accurate. |
OTIF; perfect order rate
Schedule adherence; expedite % of COGS
|
Baseline OTIF; root-cause top 3 failure modes
Enforce promise-date governance and escalation rules
|
| Operations | Build a training-to-competency system (skill ladders + standard work) | Skills shortages are structural. Capability systems outperform hiring-only strategies and stabilize quality. |
Time-to-competency; turnover
FPY; safety (TRIR); OEE
|
Define skill matrices for top roles and stations
Deploy microlearning + certification checkpoints
|
| Operations | Focus AI on workflow use cases (quality, maintenance, documents) | AI scales when embedded into daily decisions (alerts, triage, approvals), not isolated pilots. |
FPY; warranty/returns; MTTR
Support response time; doc cycle time
|
Pick 2 use cases; define thresholds + owners
Integrate alerts into daily tier meetings and workflows
|
| Cross-functional | Create an engineering-led sales enablement pack aligned to personas | Committees buy: ops, engineering, quality, procurement, finance. Proof must match each role’s risk lens. |
Win rate; sales cycle length
“No decision” rate; stage conversion
|
Build persona one-pagers + proof sheets (Ops/Eng/QA/Proc/Fin)
Publish ROI calculator + integration/compliance docs
|
| Cross-functional | Align pipeline-to-production (demand signals → capacity → promise) | Marketing can’t scale if ops can’t deliver reliably; reliability becomes the brand and impacts retention. |
Backlog health; forecast accuracy
On-time promise; NPS/retention (if tracked)
|
Weekly S&OP-lite cadence with shared assumptions
Connect CRM pipeline stages to capacity + lead-time updates
|
Tip:
To operationalize, assign an executive owner per row and set a weekly metric review cadence; treat each KPI movement as a hypothesis with a test plan.
Priority Sequencing (what to do first)
Next 0–90 days: “Reliability + Proof + Speed”
- Operations: OTIF baseline + top failure modes + promise-date governance
- Marketing: RFQ fast path + search capture + proof assets (video/case studies)
- Finance: working-capital war room + ROI templates tied to downtime/labor
3–9 months: “Scale the system”
- MES/traceability improvements that support customer requirements
- Workflow AI use cases integrated into daily ops
- Event ROI systematized (retargeting + meetings + attribution)
9–18 months: “Differentiate with outcomes”
- Outcome-based service contracts (uptime, response time, availability)
- Data-backed differentiation (benchmarks, monitored performance, lifecycle dashboards)
8. Appendices & Sources
This section documents data sources, supporting datasets, and limitations used throughout The State of American Manufacturing report. All sources are public, reputable, and verifiable. No proprietary or non-public data is used.
Raw Data Tables
Core time series used for market sizing, growth rates, and macro context.
| Table / dataset | Suggested fields (CSV columns) | Primary use |
|---|---|---|
| Manufacturing value added (GDP) | Date, NAICS, value_added_usd, share_of_gdp | Industry size, growth, cyclicality, share trends |
| Industrial production & capacity utilization | Date, index_value, capacity_utilization_pct, yoy_pct | Demand pulse, capacity tightness, cycle timing |
| Capex indicators (durable goods / equipment) | Date, capex_proxy_usd, yoy_pct, category | Investment appetite, automation tailwinds |
| Employment, wages, productivity | Date, employment, avg_wage, hours, productivity_index | Labor constraints, cost pressure, efficiency trends |
Transaction, valuation, and unit-economics scaffolding for Section 2 analysis.
| Table / dataset | Suggested fields (CSV columns) | Primary use |
|---|---|---|
| M&A transactions (industrial/manufacturing) | announce_date, buyer, seller, deal_value, geography, rationale | Deal flow, consolidation themes, capability buys |
| PE/VC rounds (industrial tech) | date, company, round_type, amount, investors, subsector | Investment hot spots, tech adoption signals |
| Public comps: multiples | date, ticker, ev, revenue_ttm, ebitda_ttm, ev_rev, ev_ebitda | Valuation context, cycle sensitivity, peer benchmarking |
| Unit economics (proxy model) | segment, gross_margin_pct, service_mix_pct, cac, ltv, ltv_cac | Commercial efficiency, pricing power, service attach value |
Channel performance, funnel metrics, and persona/journey tables for Section 3.
| Table / dataset | Suggested fields (CSV columns) | Primary use |
|---|---|---|
| Channel performance (by month) | month, channel, spend, leads, cpl, cql, sql, pipeline, roi | ROI by channel, budget shifts, attribution sanity checks |
| Funnel conversion benchmarks | stage_from, stage_to, conversion_pct, median_days, segment | Cycle time, bottlenecks, enablement needs |
| Content performance (proof assets) | asset_type, topic, views, engagement, assisted_pipeline, win_rate_lift | Proof library prioritization, messaging that converts |
| Event ROI tracking | event, date, cost, meetings, sqls, pipeline, wins, payback_months | Events accountability, follow-through system design |
Execution KPIs, workforce capability, and tech adoption tables for Section 4.
| Table / dataset | Suggested fields (CSV columns) | Primary use |
|---|---|---|
| Fulfillment & service KPIs | week, otif, perfect_order, lead_time_days, backlog, expedite_spend | Reliability, customer experience, margin leakage |
| OEE & downtime | day, line, oee, availability, performance, quality, downtime_code | Constraint analysis, maintenance prioritization |
| Workforce capability | role, headcount, turnover, training_hours, time_to_competency, safety | Skill bottlenecks, ramp planning, retention strategy |
| Quality outcomes | week, fpy, scrap_rate, rework_hours, returns, warranty_rate | Margin protection, customer risk, corrective actions |
| Tech stack adoption (ERP/MES/AI) | site, erp, mes, qms, data_platform, ai_use_cases, integration_score | Maturity benchmarking, roadmap sequencing |
Next step:
If you want these as actual downloadable CSVs, tell me your preferred schema (single wide table vs. normalized tables) and I’ll generate the files.
Hyperlinked Source List (Primary References)
Government & Multilateral
- U.S. Bureau of Economic Analysis (BEA)
Manufacturing GDP, value added, capital investment
https://www.bea.gov/data/gdp/gross-domestic-product - U.S. Bureau of Labor Statistics (BLS)
Employment, wages, productivity, labor shortages
https://www.bls.gov/iag/tgs/iag31-33.htm - Federal Reserve (FRED)
Industrial Production Index, capacity utilization
https://fred.stlouisfed.org/series/INDPRO - U.S. Census Bureau
Annual Survey of Manufactures
https://www.census.gov/programs-surveys/asm.html
Industry & Research Firms
- McKinsey & Company — Manufacturing & Operations
Automation, AI, productivity, supply chain resilience
https://www.mckinsey.com/capabilities/operations/our-insights - Deloitte — 2024 Manufacturing Industry Outlook
Workforce, digital transformation, margin pressure
https://www2.deloitte.com/us/en/pages/manufacturing/articles/manufacturing-industry-outlook.html - Boston Consulting Group (BCG)
Smart factories, digital twins, operational excellence
https://www.bcg.com/industries/industrial-goods/overview - PwC — Industrial Manufacturing Trends
Cost inflation, reshoring, digital ops
https://www.pwc.com/us/en/industries/industrial-products.html
Investment & M&A
- PitchBook (summary reports)
Industrial PE/VC activity, M&A volume
https://pitchbook.com/news/reports - S&P Capital IQ / S&P Global Market Intelligence
Public comps, valuation multiples
https://www.spglobal.com/marketintelligence - Bain & Company — Global M&A Report
Industrial deal trends, carve-outs
https://www.bain.com/insights/topics/global-ma-report/
Automation, Technology & Operations
- International Federation of Robotics (IFR)
Robotics adoption, density, use cases
https://ifr.org/ - World Economic Forum — Global Lighthouse Network
Smart manufacturing case studies
https://www.weforum.org/communities/global-lighthouse-network/ - Gartner — Manufacturing IT & OT Research
ERP, MES, analytics, AI adoption patterns
https://www.gartner.com/en/manufacturing
Marketing & Buyer Behavior (B2B / Industrial)
- Gartner — B2B Buying Journey
Buyer self-service, rep-free research
https://www.gartner.com/en/sales/insights/b2b-buying-journey - Think with Google — Industrial B2B Search Behavior
Search intent and decision cycles
https://www.thinkwithgoogle.com/marketing-strategies/b2b/ - Content Marketing Institute (CMI)
B2B content and video effectiveness
https://contentmarketinginstitute.com/research/
Notes on Data Limitations & Methodology
- Sector breadth: “American Manufacturing” spans diverse subsectors (discrete, process, aerospace, automotive, food, chemicals). Benchmarks may vary materially by vertical.
- Time lag: Government data often lags 3–12 months; directional trends are prioritized over point estimates.
- Self-reported bias: Survey-based sources may overstate digital maturity or AI adoption.
- Private company opacity: Financial metrics (margins, burn, CAC) are inferred from disclosed comps and advisory benchmarks—not audited private data.
- Scenario sensitivity: Forecasted ranges assume a moderate macro environment (no severe recession or boom).
Disclaimer: The information on this page is provided by Manufacturing.co for general informational purposes only and does not constitute financial, investment, legal, tax, or professional advice, nor an offer or recommendation to buy or sell any security, instrument, or investment strategy. All content, including statistics, commentary, forecasts, and analyses, is generic in nature, may not be accurate, complete, or current, and should not be relied upon without consulting your own financial, legal, and tax advisers. Investing in financial services, fintech ventures, or related instruments involves significant risks—including market, liquidity, regulatory, business, and technology risks—and may result in the loss of principal. Manufacturing.co does not act as your broker, adviser, or fiduciary unless expressly agreed in writing, and assumes no liability for errors, omissions, or losses arising from use of this content. Any forward-looking statements are inherently uncertain and actual outcomes may differ materially. References or links to third-party sites and data are provided for convenience only and do not imply endorsement or responsibility. Access to this information may be restricted or prohibited in certain jurisdictions, and Manufacturing.co may modify or remove content at any time without notice.