
The State of Mexican Manufacturing Market Research Report
1. Industry Overview and Executive Summary
Size, growth, macro outlook
Mexico’s manufacturing sector is big, export-heavy, and unusually plugged into the US economy. That combination is why it keeps showing up in nearshoring board decks, even when the macro news gets choppy.
At the macro level, Mexico’s GDP in 2024 was about $1.856T (current US$). (World Bank Open Data)
Manufacturing is not a side quest in Mexico. It represents roughly one-fifth of GDP. The World Bank’s manufacturing value added (% of GDP) shows 2024 at 19.64% and 2023 at 20.26%. (World Bank Open Data, TheGlobalEconomy.com)
Exports are the sector’s oxygen supply. INEGI’s Exports by State (ETEF) reports that exports by state-of-origin were $552.724B in 2024, which represented 89.5% of the total exports recorded in Mexico’s national trade statistics (method note: ETEF is “exports attributed to states,” not a perfect duplicate of the trade balance totals). (INEGI)
Macro reality check: “manufacturing tailwinds” and “smooth growth” are not the same thing. Mexico can attract factories and still have quarters where industrial activity cools, labor tightens, or infrastructure strains. So the opportunity is real, but it comes with operational and policy variability.
Key drivers of industry growth
- Nearshoring and time-to-market pressure
This is the core story: many North American supply chains want shorter lead times, less ocean exposure, and easier engineering iteration. Mexico is the closest large-scale manufacturing platform to the US consumer market, with dense cross-border transport links. - Export gravity and corridor economics
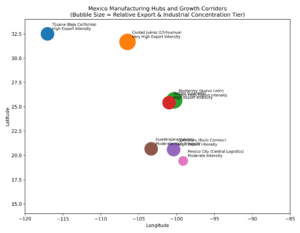
Manufacturing growth in Mexico is not evenly spread. It concentrates in corridors where the economics work: border access, intermodal connectivity, supplier depth, and labor pools. The “industrial corridors” style maps in the visuals above capture how site selectors typically frame it: Northern border, Bajío, and the broader Mexico City/central logistics basin, plus select port-linked regions. - IMMEX as the operating system for export manufacturing
The IMMEX program is a big part of how Mexico scales export production (especially for maquila and export services). Even a lightweight read of current IMMEX reporting is enough to see the footprint: millions employed and thousands of participating establishments. One recent IMMEX summary article citing INEGI reports ongoing tracking of employment and wage movement across IMMEX establishments (the point here is the measurable scale and monthly visibility, not one month’s wiggle). (Mexico Business News)
Cross-functional summary (finance, marketing, ops)
Finance: where money is getting made or lost
What’s driving financial outcomes right now is less about “cheap labor” and more about throughput, utilization, and cash conversion.
Practical finance takeaways:
- Export exposure is a superpower and a vulnerability. When exports are this dominant, demand swings, border frictions, and compliance shifts hit fast. (INEGI)
- Capacity is valuable, but only if it’s qualified capacity. Buyers pay for suppliers who can ramp, pass audits, and deliver repeatably. That changes how you should think about capex returns (tooling, QA systems, traceability, training).
Marketing: how buyers choose suppliers in 2025–2026
Manufacturing sales is not won with clever taglines. It’s won with proof and speed.
- Buyers increasingly start with research: capabilities pages, certifications, case studies, and evidence of quality performance.
- Your “marketing” is often your operational credibility packaged clearly: on-time delivery, scrap rate controls, audit readiness, engineering support, and a clean RFQ process.
Operations: the real differentiator
Operations is where nearshoring either turns into a win or becomes an expensive headache.
- The corridor you pick matters as much as the building you pick. Your logistics plan, broker relationships, and border playbook will quietly decide your customer experience.
- Labor competition is real in hot corridors. If you’re in a tight region, your retention plan and supervisor bench strength matter as much as your equipment list.
Industry Snapshot Table
| Metric | Latest datapoint | What it tells you | Source |
|---|---|---|---|
| Mexico GDP (current US$) | $1.856T (2024) | Large economic base that supports deep supplier ecosystems and big-ticket industrial capex. | World Bank |
| Manufacturing value added (% of GDP) | 19.64% (2024); 20.26% (2023) | Manufacturing remains a core pillar, roughly one-fifth of the economy. | World Bank |
| Exports by state-of-origin (ETEF) | $552.724B (2024) | Export production is massive and geographically concentrated; ETEF attributes exports to state-of-origin (not a perfect duplicate of the national trade balance totals). | INEGI (ETEF) |
| IMMEX establishments | 6,520 (Dec 2024) | Scale of the export-manufacturing operating system (maquila/export manufacturing footprint). | INEGI (IMMEX bulletin) |
| IMMEX employment | 3.23M (Dec 2024) | Deep labor base for export manufacturing; also implies wage and skills competition in key corridors. | INEGI (IMMEX bulletin) |
| Aerospace exports | ~$10.7B (2024) | Evidence of higher-complexity manufacturing growth in specific clusters. | International Trade Administration |
| Mexico FDI inflows | ~$36.9B (2024) | Capital continues to flow in despite macro volatility; supports industrial buildout narrative. | El País (reporting) |
Global Hubs or Growth Geographies
2. Finance and Investment Landscape
This is the part of the story where optimism meets spreadsheets. Mexico’s manufacturing boom narrative is real, but capital doesn’t move on vibes. It moves when buyers can see cash flow, capacity, and risk in the same frame.
Recent M&A activity (deal volume, major acquirers)
Mexico’s overall M&A market has been uneven: fewer deals at times, but chunky transactions still get done. One public summary citing TTR Data reported that Mexico logged 149 M&A transactions in the first seven months of 2025 totaling about $14.58B, down in volume but up in value versus the same period the year before. (Mexico Business News)
For manufacturing, a lot of the most strategically relevant deals are “adjacent” (logistics, packaging, industrial inputs) because that’s where nearshoring bottlenecks show up first.
Deal table (manufacturing and nearshoring-adjacent, publicly disclosed)
| Buyer | Seller / target | Why it matters for Mexican manufacturing | Announced | Deal value | Source |
|---|---|---|---|---|---|
| Cabot Corporation | Mexico Carbon Manufacturing (MXCB), from Bridgestone | Adds/expands industrial materials capacity in Mexico; close to existing Altamira footprint | Aug 4, 2025 | Not disclosed | Cabot press release |
| Specialized Packaging Group | ArkPack de México (Monterrey assets) | Packaging capacity near a major industrial hub; packaging becomes a bottleneck when volumes ramp | Jul 29, 2025 | Not disclosed | PR Newswire |
| UPS | Estafeta (agreement announced; later terminated) | Signals how valuable Mexico-linked logistics networks are, even when specific deals don’t close | Jul 22, 2024 | Not disclosed | UPS press release |
Investment trends (PE/VC rounds, IPOs, dry powder)
What investors are hunting in and around Mexican manufacturing right now tends to fall into four buckets:
- Capacity with proof
Factories that already run stable programs and can add lines without breaking quality. - Compliance-native platforms
Companies that make traceability, customs, documentation, labor compliance, and regulated-quality “boringly reliable.” - Industrial services that reduce downtime
Maintenance, tooling, testing, calibration, and automation integrators. - Logistics and packaging infrastructure
Because you can build the best plant in the world and still miss shipments if border routing and packaging fall apart.
At the market level, deal activity has shown sensitivity to policy uncertainty and tariff headlines, which can slow decision-making even when the long-term nearshoring logic remains intact. (ION Analytics)
Revenue models and unit economics (LTV, CAC, margins)
Manufacturing unit economics are very real, but they’re not naturally expressed as LTV:CAC the way software is. Still, you can translate the logic if you define the “unit” as a customer program, not a single sale.
Common revenue models you’ll see in Mexico’s export manufacturing
- Contract manufacturing programs (often multi-year, with engineering changes and periodic repricing)
- Tier supplier programs (longer lifecycles, heavy qualification/PPAP work up front in automotive)
- Industrial inputs and components (repeat orders; more exposure to cycle swings)
- Product + services hybrids (tooling, testing, design-for-manufacture support)
Margins: what “healthy” often looks like (using a defensible benchmark)
For automotive component suppliers globally, S&P Global’s 2025 review reported average gross margin around 18.6% and average EBITDA margin around 10.5% across its cohort (with medians lower). Treat that as a reference point for mature suppliers, not a guarantee for any one plant or Mexico-specific segment. (S&P Global)
A practical LTV:CAC model for manufacturing programs (how to compute it without fooling yourself)
CAC (program acquisition cost) often includes:
- Sales engineering hours (RFQs, DFM feedback, quoting cycles)
- Travel and site visits, audits, supplier-quality time
- Samples, prototypes, trial runs, line changeovers during validation
LTV (program lifetime value) can be approximated as:
- Annual gross profit (or contribution margin) from the program
- Multiplied by expected program life (years)
- Discounted by retention risk, pricing pressure, and re-sourcing probability
If you want one metric ops, finance, and sales can actually share without fighting: use payback period.
Payback period = CAC / monthly gross profit from the program
LTV:CAC Ratio Chart
| Scenario | Program Life (Years) | CAC (one-time) | Annual Revenue | EBITDA Margin (assumed) | Annual EBITDA | LTV (EBITDA-based, undiscounted) | LTV:CAC | CAC Payback (Months) |
|---|---|---|---|---|---|---|---|---|
| Conservative | 3 | $150,000 | $2,500,000 | 10% | $250,000 | $750,000 | 5.0x | 7.2 |
| Base Case | 5 | $150,000 | $2,500,000 | 10% | $250,000 | $1,250,000 | 8.3x | 7.2
|
| Upside | 7 | $150,000 | $2,500,000 | 10% | $250,000 | $1,750,000 | 11.7x | 7.2 |
Financial health indicators (what to watch that actually predicts pain)
Manufacturing businesses can look profitable on paper and still be cash-stressed. The most diagnostic indicators tend to be:
- Cash conversion cycle
Receivables + inventory days can balloon during ramps. A “busy” plant can be a cash sink if collections lag and WIP piles up. - Customer concentration
Many suppliers live with a top-3 customer reality. That’s fine until one customer re-sources, demands a price reset, or delays payments. - Utilization and mix
A plant can be “full” and still under-earning if it’s running low-margin mix on its constrained resources. - FX and input cost pass-through
If revenue is USD-linked and costs are MXN-linked (or the reverse), hedging and pricing clauses matter more than the headline margin. - Quality cost curve
Scrap, rework, warranty exposure, and customer chargebacks are the silent killers. The healthiest operators track these like a hawk and treat corrective action cycle time as a financial metric, not a quality department chore.
EV/Revenue + EV/EBITDA Multiples
| Benchmark type | Segment / example | Geography / universe | As-of date | EV/Revenue | EV/EBITDA | Notes | Source |
|---|---|---|---|---|---|---|---|
| Notable transaction | Amcor plc → Berry Global Group, Inc. | North America / global packaging | Q4 2024 (announced) | 1.3x | 8.1x | Transaction multiples cited in the Q4 2024 manufacturing update. | MNP Q4 2024 PDF |
| Notable transaction | Novolex Holdings LLC → Pactiv Evergreen Inc. | North America / foodservice & packaging | Q4 2024 (announced) | 1.3x | 8.0x | Transaction multiples cited in the Q4 2024 manufacturing update. | MNP Q4 2024 PDF |
| Public comps (median) | Aerospace Product Manufacturing (NAICS 3364) – median | Publicly traded comps | Q4 2024 | 3.1x | 23.0x | Medians from a public comps table (market-cap weighted approach may vary by table). | PW&Co Q4 2024 PDF |
| Public comps (median) | Food Manufacturing (NAICS 311) – median | Publicly traded comps | Q4 2024 | 2.5x | 13.6x | Medians from a public comps table; useful as a sanity-check range for mature operators. | PW&Co Q4 2024 PDF |
| Public comps (median) | Paper Manufacturing (NAICS 322) – median | Publicly traded comps | Q4 2024 | 1.2x | 10.1x | Medians from a public comps table; paper/packaging often trades at lower revenue multiples than high-growth segments. | PW&Co Q4 2024 PDF |
| Public comps (median, partial) | Architectural & Structural Metal Mfg. (NAICS 3323) – median | Publicly traded comps | Q4 2024 | 1.3x | NA | Median EV/Revenue shown; EV/EBITDA not shown as a usable median in the table excerpt (often impacted by negative EBITDA). | PW&Co Q4 2024 PDF |
3. Marketing Performance and Trends
If finance is the fuel, marketing is the steering wheel. In Mexican manufacturing, “marketing” rarely means catchy slogans. It means making it easy for a risk-averse buyer to believe you can hit quality, delivery, and compliance without drama.
Channel breakdown: what actually drives pipeline
The short version: buyers want to research quietly, shortlist fast, and only then talk to a human. That’s not a theory anymore. McKinsey’s 2024 B2B Pulse findings describe a durable split between digital self-serve, remote interaction, and in-person, and note that digital can drive a meaningful share of revenue for companies that offer it. (McKinsey & Company)
Gartner’s 2024 buyer survey adds a sharper edge: most buyers prefer to do independent research through digital channels, and a large share actively avoid suppliers that send irrelevant outreach. (Gartner)
So for Mexican manufacturers selling into North America, your job is to be findable, credible, and specific. Here’s how the channel mix usually shakes out:
Multi-channel performance table
| Channel | Best use case | What “good” looks like | Typical ROI pattern | Common failure mode |
|---|---|---|---|---|
| SEO (capability + compliance pages) | Getting on the shortlist before the first call | Pages built around processes, tolerances, certifications, and industries served, with a fast RFQ path | Compounds over time; low marginal cost per incremental lead | Generic pages attract low-fit leads and waste sales engineering time |
| Industrial directories / discovery platforms | Capturing active sourcing demand | Category-specific listings refreshed with proof assets (certs, case studies, capabilities) | High intent when categories spike; steady baseline for certain niches | Set-and-forget listings go stale, rankings slip, and inbound quality drops |
| Paid search | High-intent capture for niche processes | Tight keyword sets (process + material + location) paired with proof-first landing pages | Efficient in narrow niches; expensive and noisy in broad categories | Buying traffic you can’t convert because proof and qualification are weak |
| LinkedIn ABM + retargeting | Reaching the buying committee at target accounts | 30–100 target accounts, proof-heavy creative, retargeting for site visitors and engaged roles | Strong for awareness + deal acceleration; improves win rate when aligned with sales | Spray-and-pray messaging triggers buyer avoidance and low engagement |
| Email nurture | Long cycles, multi-stakeholder deals | Short cadence, useful updates, plant tour invites, and sector-specific proof assets | Great for reactivation, late-stage confidence, and post-show follow-up | Over-automated sequences feel spammy and reduce trust |
| Trade shows / events | Fast pipeline creation with serious buyers | Pre-booked meetings plus disciplined follow-up within 48 hours | High when follow-up is tight; uneven when teams treat it as “brand” only | Leads die in the CRM after the show; no next step, no conversion |
| Referrals / site selectors / brokers | Large projects and plant-location decisions | Clear partner enablement kit (capabilities, certifications, capacity, ramp plans) | High close rates, lower volume; can shorten trust-building | Over-dependence on intermediaries weakens direct brand pull |
| Webinars / technical sessions | Engineer-to-engineer credibility and differentiation | Deep dives like “How we solved X defect” or “DFM for Y material” with real examples | High quality, lower volume; strong influence in regulated/complex buying | Salesy content loses technical audiences and reduces attendance |
Buyer behavior trends (demographics, psychographics, decision triggers)
The buying committee is usually 3–7 people, and they don’t all want the same thing:
- Procurement wants cost control, continuity, and supplier risk reduction.
- Supplier quality wants proof: corrective action discipline, traceability, certifications, audit history.
- Ops wants reliability and ramp speed: “If a line goes down, will you respond like it’s your problem too?”
Three buyer shifts that matter right now
- More rep-free research, more selective human time
Gartner’s survey reporting shows a strong preference for rep-free experiences and highlights how buyers respond negatively to irrelevant outreach. Translation: you earn the right to call them by being useful before you talk. (Gartner) - Digital and hybrid journeys are stable, not a temporary COVID artifact
McKinsey describes this as a persistent “rule of thirds” across digital self-serve, remote, and in-person interactions. For most manufacturers, that means your website and proof assets are now part of your sales team. (McKinsey & Company) - Industrial sourcing data is getting more transparent
Industrial discovery platforms are publishing category-level sourcing behavior reports based on actual sessions (for example, Thomas’s annual and monthly sourcing reporting). Even if you don’t use their platform heavily, the direction is helpful: buyers are researching at scale, and their attention shifts with macro events and supply chain constraints. (Distribution Strategy Group, sourcing.thomasnet.com, business.thomasnet.com)
Creative and messaging that performs best
The creative that wins in manufacturing is basically anti-hype. Buyers are trained to distrust fluffy claims because a bad supplier creates real operational pain.
Messaging frameworks that consistently convert
- Proof pack messaging
Instead of “high quality,” use:
- On-time delivery (last 12 months)
- PPM trend or scrap trend (even if you don’t share raw numbers publicly, show a chart shape)
- Certifications (ISO, IATF, AS9100, etc.)
- Audit readiness and corrective action approach (8D discipline)
- Specificity beats breadth
“We do injection molding” is table stakes.
“We do glass-filled nylon molding for under-hood automotive components, with PPAP support and documented traceability” is shortlist material. - Risk language, not ego language
Strong lines often sound like:
- “Here’s how we prevent line stops.”
- “Here’s our ramp plan and what can go wrong.”
- “Here’s what we need from you to hit SOP on time.”
Market positioning and brand perception
Positioning that works in Mexico’s export manufacturing tends to cluster into three archetypes:
- The compliance-native supplier
Owns traceability, audits, documentation, and regulated customer expectations. - The ramp-speed specialist
Wins programs where time-to-SOP matters more than squeezing the last cent. - The integration partner
Engineering + manufacturing + logistics coordination so the buyer manages fewer vendors.
Journey Diagram
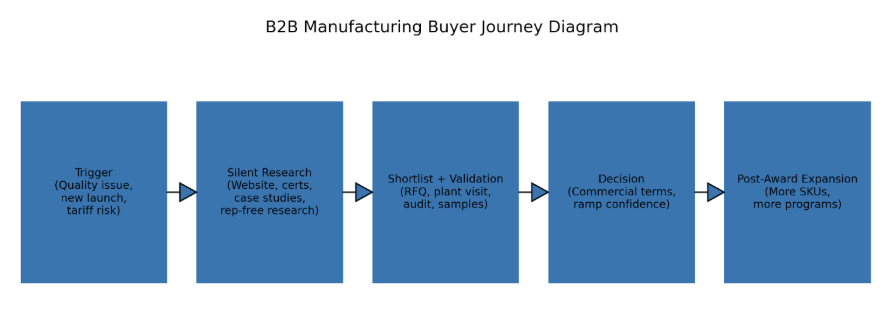
4. Operational Benchmarking
This is where strategy becomes real. Mexico can win on proximity and trade structure, but operational performance is what decides whether nearshoring becomes margin expansion or margin erosion.
Supply chain and logistics
Mexico’s core structural advantage is geographic proximity to the United States. For North American buyers, that means shorter transit times, more predictable lead times, and faster engineering iteration cycles compared to Asia-based supply chains. Nearshoring analyses consistently cite time-to-market and logistics compression as primary drivers of investment into Mexico.
Source: Roland Berger, Nearshoring in Mexico report
https://www.rolandberger.com/publications/publication_pdf/Nearshoring-in-Mexico_Roland-Berger-Report-2024.pdf
However, the proximity advantage only converts into performance if operators manage three variables well:
- Border throughput risk
Congestion at major crossings can create variability in transit time. Manufacturers that build broker redundancy, pre-clear documentation, and dynamic routing plans reduce volatility. - Infrastructure strain in hot corridors
Industrial growth has outpaced infrastructure in some regions. Electricity availability, water stress, and industrial park capacity can affect ramp timelines. - Supplier depth by region
Northern and Bajío corridors have dense automotive and electronics ecosystems. Other regions may require supplier development investment.
IMMEX as the export operating backbone
The IMMEX program underpins much of Mexico’s export manufacturing model. As of December 2024:
- 6,520 IMMEX establishments
- 3.23 million employees
This provides scale, but it also signals wage competition in concentrated industrial zones.
Source: INEGI IMMEX Bulletin (Dec 2024)
https://www.inegi.org.mx/contenidos/saladeprensa/boletines/2025/immex/immex2025_02.pdf
Operational insight: When hiring tightens in Tier 1 corridors, supervisory quality becomes a differentiator. Plants with deep middle-management benches outperform in scrap control, ramp stability, and corrective action discipline.
Workforce structure
Typical workforce composition in export-oriented plants:
- Operators and technicians (majority of headcount)
- Quality engineers and supplier quality
- Maintenance and tooling
- Production supervisors
- Planning and logistics
- Sales engineering / program management (for Tier suppliers)
Trends shaping workforce strategy:
- Technical skill compression
Higher-complexity sectors (aerospace, electronics) require tighter quality controls and documentation discipline. - Rising wage pressure in high-density corridors
Clusters like Nuevo León, Chihuahua, and Baja California see labor competition intensify first. - Leadership capability gap
Execution risk often sits at the supervisor layer, not at the C-suite level.
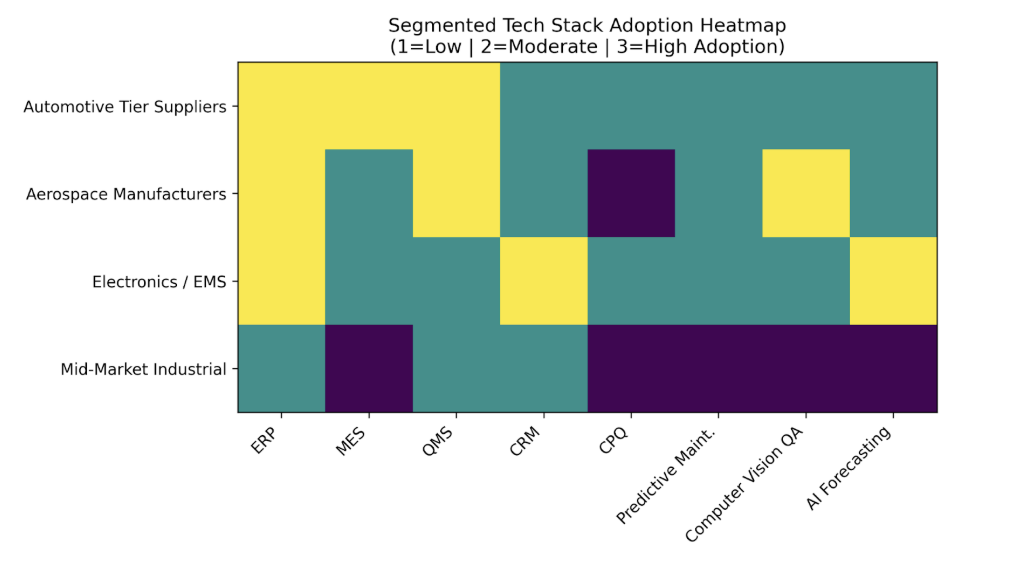
Tech stack: what modern operators use
Core operations systems:
- ERP (SAP, Oracle, Microsoft Dynamics in larger firms)
- MES (Manufacturing Execution Systems) for shop-floor visibility
- QMS modules for regulated sectors (automotive IATF, aerospace AS9100)
Commercial systems:
- CRM (Salesforce, Dynamics, HubSpot in mid-market)
- CPQ or structured quoting tools (less common but growing)
Automation and AI applications:
- Computer vision for defect detection
- Predictive maintenance pilots
- Demand forecasting enhancements
- Automated document compliance workflows
Adoption remains uneven. Larger multinational plants adopt faster. Mid-market operators often prioritize automation only when labor tightens or quality escapes become costly.
Fulfillment and customer service strategy
In manufacturing, “customer service” often equals “program management.”
Best-performing operators:
- Assign dedicated program managers to major accounts
- Conduct monthly performance reviews (OTD, PPM, corrective actions)
- Share ramp dashboards during new program launches
The goal is simple: make the buyer feel operationally safe.
Regulatory and compliance hurdles
Common operational compliance pressure points:
- Customs and rules-of-origin compliance (USMCA)
- Labor compliance standards tied to international buyers
- Environmental permits at state and municipal levels
- Quality certifications (IATF 16949, ISO 9001, AS9100, etc.)
Failure here is not a marketing problem. It is a shipment-stopping problem.
Nearshoring execution risks
Even strong macro tailwinds can be undermined by:
- Overpromising ramp timelines
- Underestimating working capital needs
- Insufficient supplier vetting
- Weak documentation discipline
- Inadequate contingency planning for border delays
The operators who win long term treat risk management as part of production, not an afterthought.
Teck Stack Heatmap
Ops KPI Table
| Ops KPI | What it measures | Why it matters | How to calculate | Good practice target (directional) | Common pitfalls | Primary owner | Review cadence |
|---|---|---|---|---|---|---|---|
| On-Time Delivery (OTD) | % of shipments delivered on or before the promised date/time | Direct driver of customer retention and program expansion; also influences chargebacks | (On-time shipments ÷ total shipments) × 100 | Trend up and stable; segment by customer and lane | Measuring against ship date instead of promised date; hiding late partials | Logistics / Supply Chain | Weekly |
| First Pass Yield (FPY) | % of units that pass without rework | High FPY reduces labor cost, scrap, and schedule volatility | (Good units without rework ÷ total units) × 100 | Improve month-over-month; tie dips to root causes by line/shift | Counting reworked units as “good” without tracking effort/time | Production + Quality | Daily / Weekly |
| Scrap Rate | % of material or units scrapped | Pure profit leakage; also signals process stability problems | (Scrap cost ÷ total production cost) × 100 or (scrap units ÷ total units) × 100 | Visible trending; “top 3 drivers” tracked and attacked | Only tracking scrap dollars (misses volume impact); not tying to line changes | Quality + Operations | Weekly |
| Overall Equipment Effectiveness (OEE) | Availability × Performance × Quality | Measures how well constrained assets are actually producing sellable output | OEE = A × P × Q (standard OEE formula) | Use as a bottleneck lens; focus on the constraint first | Chasing OEE everywhere instead of focusing on the bottleneck | Operations / Maintenance | Daily / Weekly |
| Quote Turnaround Time | Speed from RFQ receipt to quote delivery | Directly impacts win rate; slow quotes die quietly | Average hours/days from RFQ timestamp to quote sent | SLA by complexity tier (e.g., 24–72 hours) | No RFQ qualification; engineering time wasted on low-fit quotes | Sales Engineering / Estimating | Weekly |
| Corrective Action Cycle Time (8D closure) | Time to close corrective actions | Signals quality maturity and reduces repeat defects / customer escalations | Average days from issue logged to verified closure | Clear SLA, escalation rules, and verification step | Closing actions without validation; weak root-cause discipline | Quality | Weekly / Monthly |
| Cash Conversion Cycle (CCC) | Inventory days + receivable days − payable days | Predicts liquidity stress during ramps and demand swings | CCC = DIO + DSO − DPO | Stable or improving; investigate spikes by customer/program | Ignoring WIP buildup; blaming finance without fixing production flow | Finance + Supply Chain | Monthly |
| Capacity Utilization (constraint-focused) | How loaded the bottleneck resource is | Margin amplifier; prevents overbooking and late shipments | (Used hours ÷ available hours) × 100 for the constraint | Operate with buffer; protect the constraint from chaos | Measuring “overall plant utilization” instead of the true constraint | Operations Planning | Weekly |
| Supplier On-Time Delivery | Inbound delivery performance from suppliers | Inbound variability drives line stops, expediting costs, and missed outbound OTD | (On-time supplier deliveries ÷ total supplier deliveries) × 100 | Segment by critical suppliers and parts; implement scorecards | Not differentiating critical vs non-critical parts; no corrective actions | Procurement / Supply Chain | Monthly |
| Inventory Accuracy | How accurately inventory records match reality | Prevents stockouts, overbuys, and planning errors | (Correct counts ÷ total counts) × 100 (cycle counting) | High and stable; cycle count on ABC prioritization | Annual counts only; ignoring WIP and locations | Warehouse / Inventory Control | Weekly / Monthly |
5. Competitor and Market Landscape
Mexican manufacturing isn’t one market with one leaderboard. It’s a portfolio of subsectors with different “kings of the hill.” The smartest way to map competition is by cluster and value chain: who anchors demand (OEMs), who captures outsourced build (EMS/CMs), who owns regulated complexity (aerospace/medical), and who controls the enabling layer (logistics, packaging, industrial services).
Top players and where they dominate
- A) Automotive (OEM anchors + Tier ecosystem gravity)
Mexico has a broad OEM base. The US International Trade Administration describes 37 light vehicle manufacturing plants across 12 states belonging to 13 OEM groups, including Audi, BMW, Ford, General Motors, Honda, Hyundai, Kia, Mazda, Nissan-Infinity, Mercedes-Benz, Stellantis, Toyota, and Volkswagen. (gov)
Why these OEMs matter competitively:
- They shape supplier qualification requirements (IATF discipline, PPAP cadence, traceability expectations).
- They concentrate supplier ecosystems around their plant footprints (and pull Tier 1s and Tier 2s with them).
- Their program launches create waves of localized sourcing and dual-sourcing mandates.
Context for scale: Mexico’s light vehicle production hit a record level in 2024 (INEGI data cited by industry press). Treat this as a signal of volume strength, not a forecast. (Mexico Business News)
- B) Aerospace (clustered complexity, not mass volume)
Aerospace is concentrated by hub and employer. The ITA’s Mexico aerospace guide highlights major clusters (e.g., Chihuahua, Querétaro, Nuevo León) and names key players with operations in those hubs, including Airbus and Bombardier in Querétaro, Boeing and GE Aviation in Chihuahua, plus others tied to composites and precision machining. (gov)
Safran is a notable anchor because of its scale in-country; Safran states it has more than 15,000 employees across 20 sites in 4 states and calls itself the number one employer in Mexico’s aerospace industry. (Safran)
How competition works in aerospace:
- It’s less “who’s biggest” and more “who can hold certifications, documentation, and quality gates without slipping.”
- Supplier selection often rewards process reliability and audit performance more than price.
- C) Electronics and EMS (outsourced manufacturing powerhouses)
In EMS, competitive leadership is often about footprint, customer concentration, and ramp speed. Mordor Intelligence’s Mexico EMS market snapshot names Flex, Jabil, Foxconn (Hon Hai), Sanmina, and Celestica among the major companies operating in Mexico. (Mordor Intelligence)
How competition works in EMS:
- Speed and volume scaling are table stakes.
- Differentiation comes from vertical expertise (medical, auto electronics), test/inspection capability, and supply chain execution.
- D) Cross-sector enablers (the “quiet giants”)
These aren’t always counted as “manufacturing,” but they determine whether manufacturing wins.
- Logistics and cross-border networks (example: UPS’s attempted acquisition of Estafeta signaled strategic interest in Mexico-linked logistics capacity, even though this particular deal later did not proceed). (Opportimes, Trade.gov)
- Industrial materials and inputs (example: Cabot’s acquisition of Mexico Carbon Manufacturing highlights investment interest in industrial inputs capacity). (Start-Ops Mexico)
Emerging startups or disruptors (what disruption looks like here)
Manufacturing disruption in Mexico tends to be practical, not flashy:
- Automation and integration firms that improve OEE and reduce quality escapes
- Quality/compliance-native suppliers that win programs from incumbents with stronger traceability and documentation
- Logistics/compliance tech that cuts border friction and paperwork error rates
Most of these disruptors won’t show up in “biggest company” lists, but they show up inside winning plants.
Strategic differences in positioning, pricing, and business model
The market separates into a few reliable archetypes:
- Scale operators
Who they are: large multinationals and major Tier suppliers
How they win: capacity, established systems, global customer relationships
Where they struggle: flexibility, speed of change, custom processes - Specialization operators
Who they are: mid-market suppliers with narrow process expertise
How they win: responsiveness, technical focus, engineering collaboration
Where they struggle: customer concentration risk, capex intensity - Compliance-first operators
Who they are: suppliers built around regulated requirements (aerospace/auto/medical)
How they win: audit readiness, documentation discipline, consistent quality performance
Where they struggle: cost base, slower experimentation, onboarding burden
Competitive Matrix (product vs. reach vs. pricing)
| Player type | Typical reach / scale | Product / process complexity | Typical pricing posture | Where they win | Where they struggle | Best-fit buyer / program |
|---|---|---|---|---|---|---|
| OEM / large Tier platform | Very high (multi-site, multi-country) | High (program discipline, qualification-heavy) | Market-based with strong contracting power; focuses on total cost, not “cheap” | Volume programs, established systems, deep supplier development, predictable execution | Flexibility, custom change requests, speed of iteration | High-volume programs with strict delivery and quality requirements |
| Global EMS provider | High (large footprints, rapid scaling) | Moderate to high (test + complex assemblies) | Competitive; margin-sensitive; pricing often tied to volume commitments | Fast ramps, electronics sourcing leverage, test/inspection capabilities | Margin pressure, customer concentration, churn in volatile categories | Electronics programs needing scale, speed, and supply chain coordination |
| Aerospace cluster anchor | Moderate (clustered hubs; fewer sites than EMS) | Very high (certification, documentation, traceability) | Premium-leaning when qualification is hard; value framed around reliability and compliance | Regulated quality systems, precision manufacturing, audit performance | Longer sales cycles, higher overhead, slower experimentation | Regulated, high-reliability programs (aerospace and adjacent) |
| Mid-market specialist supplier | Moderate (1–3 sites typical) | Moderate to high (niche process expertise) | Value-based within niche; can price for responsiveness and technical fit | Speed, customization, engineering collaboration, niche capabilities | Capex constraints, customer concentration risk, talent bottlenecks | Programs needing quick iteration, specialized processes, or close collaboration |
| Low-cost commodity producer | Low to moderate | Low to moderate | Price-led; competes on unit cost and basic capacity | Cost-focused, stable-spec parts; high competition bidding | Quality differentiation, documentation rigor, performance consistency under pressure | Standardized components where price dominates and qualification is lighter |
| Automation / compliance disruptor (enabler) | Low to moderate (scales via deployments, not plants) | Moderate (process + data integration) | ROI-based (often subscription + services or project-based) | Productivity gains, defect reduction, uptime improvement, faster documentation workflows | Integration friction, long sales cycles, proving ROI in messy environments | Plants facing quality escapes, labor tightness, or uptime constraints |
SWOT-Style Summary of Top 5 Players
| Company | Segment | Strengths | Weaknesses | Opportunities | Threats |
|---|---|---|---|---|---|
| Safran | Aerospace | Large Mexico footprint; deep aerospace expertise; strong certification and compliance discipline; anchor presence in key clusters. | High regulatory burden; longer qualification cycles; higher overhead structure. | Growth in North American aerospace demand; supplier consolidation; nearshoring of high-precision work. | Talent shortages in advanced machining/composites; global aerospace demand volatility. |
| Flex | Electronics Manufacturing Services (EMS) | Global scale; rapid ramp capability; supply chain leverage; diversified vertical exposure. | Margin pressure in competitive bids; customer concentration risk. | Expansion in automotive electronics and medical devices; North American regionalization. | Demand swings in electronics; pricing compression from OEMs. |
| Jabil | Electronics Manufacturing Services (EMS) | Broad vertical capability; strong program management; global customer relationships. | Complex portfolio; exposure to cyclical end markets. | High-mix/high-reliability programs; supply chain localization. | Supply chain shocks; geopolitical sourcing shifts. |
| Foxconn (Hon Hai) | Electronics Manufacturing Services (EMS) | Massive scale; advanced manufacturing capability; strong cost discipline. | Reliance on large customers; margin sensitivity. | Regional manufacturing diversification into Mexico; advanced assembly growth. | Customer insourcing; pricing pressure; geopolitical trade shifts. |
| Volkswagen Group (Mexico operations) | Automotive OEM | Established production base; strong export integration with North America; supplier ecosystem pull. | Capital intensity; exposure to automotive cycle. | EV platform localization; supplier ecosystem expansion; regional demand growth. | EV transition uncertainty; tariff/policy volatility; global auto demand slowdown. |
6. Trend Analysis and Forward Outlook
If the last five years proved anything, it’s this: Mexican manufacturing is no longer just a cost story. It’s a resilience story. A geopolitics story. A speed-to-market story. The capital flows, the plant expansions, the cross-border redesigns, they’re all reacting to one big shift: supply chains are being rewired for proximity and predictability.
But this isn’t a straight line up. There are friction points. Let’s break it down.
Macroeconomic factors shaping the next 3–5 years
- Interest rates and capital costs
Manufacturing expansion is capex-heavy. Higher global rates have increased financing costs for plant expansions, tooling, and automation projects. That slows marginal projects, especially for mid-market suppliers without strong balance sheets.
Impact:
- Larger multinationals expand first.
- Smaller Tier 2 and Tier 3 suppliers become acquisition targets instead of organic builders.
- Automation investments face higher internal ROI thresholds.
2. Inflation and wage pressure
Northern industrial corridors have experienced tight labor markets. Wage growth in concentrated hubs (Nuevo León, Chihuahua, Baja California) pressures margins, especially in labor-intensive processes.
Operational consequence:
- Accelerated automation pilots.
- Increased focus on productivity per headcount.
- Growing interest in second-tier corridors with lower labor intensity.
3. USMCA and regionalization
Trade alignment under USMCA remains one of Mexico’s strongest structural advantages. Regional content rules in automotive and the strategic push to reduce Asia exposure continue to support nearshoring logic.
However:
- Policy uncertainty or tariff rhetoric can slow board-level decisions.
- Compliance complexity increases documentation and audit costs.
4. FDI momentum
Mexico attracted roughly $36–37B in foreign direct investment in 2024, maintaining strong inflows despite global volatility (reporting by El País referencing official data).
What that signals:
- Multinationals are still committing long-term capital.
- Industrial real estate and supplier ecosystems will continue expanding.
- Competition for skilled labor will intensify.
Tech disruptions transforming the factory floor
AI and automation aren’t hype here. They’re defensive tools.
- Computer vision for quality
Plants are increasingly piloting machine vision to reduce defect escape rates. This is especially critical in automotive and aerospace supply chains, where PPM levels directly influence customer retention.
Short-term impact:
- Capex spike.
- Learning curve in integration.
Long-term impact: - Lower scrap.
- Stronger audit positioning.
- Predictive maintenance
Unplanned downtime in constrained lines is margin poison. Predictive maintenance platforms are gaining traction where downtime costs are high and labor to monitor equipment is scarce.
- AI-enabled demand forecasting
Electronics and mixed-volume suppliers are exploring AI-enhanced forecasting to reduce inventory swings and improve cash conversion cycles.
The nuance:
Adoption is uneven. Large multinational plants move faster. Mid-market firms adopt when pain becomes visible.
Consumer and buyer sentiment trends
Even though manufacturing is B2B, downstream consumer demand matters.
Key shifts:
- EV adoption and electrification are reshaping automotive supply chains.
- Medical and aerospace demand remains structurally resilient but cyclical.
- Electronics demand is volatile but strategically important for regionalization.
On the buyer side:
- Preference for rep-light, research-heavy journeys persists.
- Risk mitigation is more important than pure cost minimization.
- Buyers want geographic redundancy.
Predicted strategic moves (finance, marketing, ops)
Finance
Expect:
- Continued bolt-on acquisitions in packaging, industrial inputs, and automation.
- Private equity interest in platform roll-ups for mid-market manufacturers.
- Greater scrutiny on working capital efficiency.
Strategic shift:
Margin resilience will matter more than revenue growth alone.
Marketing
Expect:
- Stronger digital proof infrastructure (case studies, certifications, plant transparency).
- Account-based marketing targeting specific OEM programs.
- More technical content aimed at engineering stakeholders.
Strategic shift:
Manufacturers that make it easy to evaluate them digitally will win more RFQs before sales even gets involved.
Operations
Expect:
- Automation investment where labor tightness is highest.
- Geographic diversification inside Mexico (beyond the most saturated corridors).
- Stronger supplier risk management and dual-sourcing strategies.
Strategic shift:
Operational maturity becomes the real differentiator, not just geographic proximity.
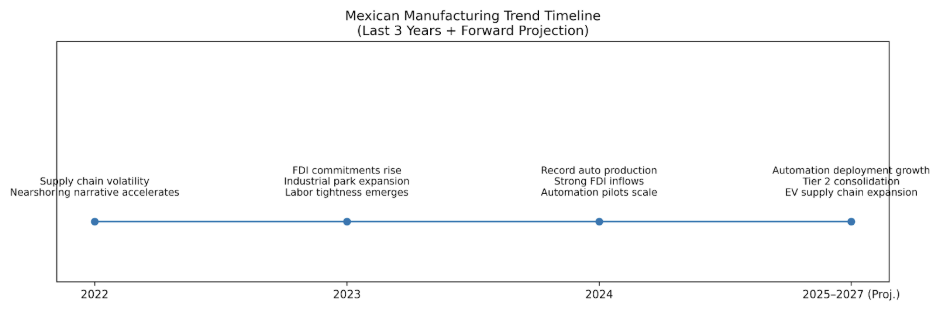
Trend Timeline (Last 3 Years + Projections)
Forecasted Spend per Channel/Function
| Area | Channel / Function | Short-term (1–2 years) | Medium-term (3–5 years) | Primary spend drivers | Where spend concentrates | Key KPI to watch |
|---|---|---|---|---|---|---|
| Marketing | SEO + capability/compliance content | Increasing | Increasing | Rep-light buying; shortlist formation happens online | Sector landing pages, certifications, case studies, RFQ flows | Qualified RFQs from organic traffic |
| Marketing | Paid search (niche processes) | Selective increase | Selective increase | High-intent capture for specialized terms | Tight keyword sets, retargeting, conversion landing pages | Cost per qualified RFQ |
| Marketing | LinkedIn ABM + retargeting | Increasing | Increasing | Buying committee targeting; longer sales cycles | Target account lists, proof-first ads, site visitor retargeting | Pipeline influenced per target account |
| Marketing | Trade shows / events | Stable to increasing | Stable | High-value relationships and fast trust-building | Pre-booked meetings, technical demos, post-event follow-up | Meetings booked to closed-won rate |
| Marketing | Partner ecosystem (brokers, site selectors, integrators) | Increasing | Increasing | Nearshoring projects flow through intermediaries | Enablement kits, co-marketing, referral programs | Partner-sourced pipeline share |
| Operations | Automation (robotics, line automation) | Increasing | Strongly increasing | Labor tightness; margin defense; throughput needs | Bottleneck processes, repetitive handling, packaging/end-of-line | OEE / labor hours per unit |
| Operations | Quality systems (QMS, traceability, metrology) | Increasing | Stable-high | Audit rigor; customer requirements; defect cost | Traceability, document control, inspection automation | PPM / FPY / cost of poor quality |
| Operations | Computer vision QA | Selective increase | Increasing | Defect escape prevention; labor efficiency | High-volume inspection points; critical-to-quality steps | Escapes per million / scrap trend |
| Operations | Predictive maintenance | Selective increase | Increasing | Downtime reduction on constrained assets | Constraint machines, high-cost downtime equipment | Unplanned downtime hours |
| Operations | Cross-border logistics resilience | Increasing | Stable to increasing | Border variability; speed-to-market expectations | Broker redundancy, routing, documentation workflows | OTD by lane / border dwell time |
| Finance | Working capital optimization | Increasing | Increasing | Ramps stress cash; inventory swings | Inventory policy, collections, supplier terms, S&OP | Cash conversion cycle (CCC) |
| Finance | M&A (capability + capacity bolt-ons) | Active | Active | Consolidation; securing constraints; adding certifications | Packaging, automation integrators, specialty processes, logistics assets | Post-merger synergy capture |
| Finance | Cybersecurity + compliance risk controls | Increasing | Increasing | Customer requirements; operational risk containment | Access controls, supplier compliance, incident readiness | Audit findings / incident rate |
| Commercial Ops | CRM + quoting modernization | Selective increase | Increasing | Faster RFQ response; better qualification | RFQ intake, quote SLAs, program profitability tracking | Quote turnaround time / win rate |
| Commercial Ops | Customer success / program management | Increasing | Stable-high | Retention and expansion drives LTV | Account reviews, dashboards, escalation playbooks | Expansion revenue / churn risk |
7. Strategic Recommendations
No investment advice here. These are operator-grade, cross-functional moves that tend to pay off because they reduce risk, tighten execution, and improve the quality of revenue. Think of them as the “make the machine run smoother” playbook.
A quick framing: in Mexican manufacturing, the easiest way to lose money is to grow fast with weak systems. The easiest way to win is to make reliability a product.
Strategy Playbook Grid
| Function | Strategic Move | Core Objective | Business Impact | Execution Priority | Key KPIs |
|---|---|---|---|---|---|
| Finance | Implement program-level profitability modeling (quote-to-cash) | Ensure growth drives margin, not just volume | Improves margin quality; prevents underpriced ramps | Immediate | Program margin %, payback period, win rate by tier |
| Finance | Tighten working capital during program ramps | Protect liquidity under growth | Reduces cash strain and expediting; stabilizes ramp economics | High | Cash conversion cycle, DSO, inventory turns, premium freight % |
| Finance | Allocate capex using constraint economics (bottleneck-first) | Maximize throughput ROI | Expands effective capacity without overbuilding | High | OEE at constraint, contribution per constrained hour, backlog burn-down |
| Marketing | Build proof-driven digital infrastructure (capabilities + compliance library) | Win before the first sales call | More qualified RFQs; shorter sales cycles | Immediate | Qualified inbound RFQs, conversion rate, proof asset engagement |
| Marketing | Deploy targeted account-based marketing (ABM) with relevance-first outreach | Focus on high-fit programs and buying committees | Improves pipeline quality and CAC efficiency | High | Target account engagement, pipeline influenced, CAC per qualified opportunity |
| Marketing | Launch supplier quality enablement assets (starter kit) | De-risk qualification early | Higher audit-to-award conversion in regulated/complex deals | Medium | Download-to-RFQ rate, audit-to-award conversion, win rate by segment |
| Operations | Engineer a border-resilient logistics playbook (redundancy by design) | Stabilize cross-border execution | Higher OTD; fewer delivery shocks and premium freight events | Immediate | OTD by lane, border dwell time, premium freight % of sales |
| Operations | Attack cost of poor quality (COPQ) with fast feedback loops | Protect margin at the source | Lower scrap/rework; fewer chargebacks; stronger customer trust | High | FPY, scrap %, COPQ, 8D cycle time, customer chargebacks |
| Operations | Prioritize automation where labor tightness and defect risk overlap (constraint-first) | Increase output without linear labor growth | Boosts throughput and consistency; improves ramp stability | High | OEE, defects per million (PPM), unplanned downtime, labor hours per unit |
| Commercial Ops | Modernize RFQ intake + quoting workflows (speed + discipline) | Increase win speed while protecting margins | Improves win rate; reduces low-fit quoting; increases program quality | Medium | Quote turnaround time, win rate, quote-to-order cycle time |
| Leadership | Build cross-functional KPI dashboards and weekly operating cadence | Align finance, sales, and ops | Reduces silos; faster issue resolution; fewer surprises | Immediate | Weekly KPI adherence, variance resolution speed, escalation frequency |
A few “human” notes that matter in the real world
- Don’t confuse demand with profitability.
A plant can be slammed and still bleed cash if ramps are unmanaged and working capital is loose. The program-level profitability model fixes that. - Make quality visible.
Buyers can forgive higher prices faster than they forgive surprises. If you can show a clean corrective action culture and stable delivery, you’re suddenly a safer choice. - Treat the border like a production step.
If it’s not engineered, it will break. Great operators build redundancy the way great engineers build safety factors.
8. Appendices and Sources
Raw data tables
| Metric | Latest datapoint | What it tells you | Source URL |
|---|---|---|---|
| Mexico GDP (current US$) | $1.856T (2024) | Economic base supporting industrial capex and supplier ecosystems. | https://data.worldbank.org/indicator/NY.GDP.MKTP.CD?locations=MX |
| Manufacturing value added (% of GDP) | 19.64% (2024); 20.26% (2023) | Manufacturing remains a core pillar, roughly one-fifth of the economy. | https://data.worldbank.org/indicator/NV.IND.MANF.ZS?locations=MX |
| Exports by state-of-origin (ETEF) | $552.724B (2024) | Scale + geographic concentration; ETEF is state-of-origin attribution (differs from national trade totals). | https://en.www.inegi.org.mx/programas/exporta_ef/ |
| IMMEX establishments | 6,520 (Dec 2024) | Export manufacturing footprint proxy (IMMEX program). | https://www.inegi.org.mx/contenidos/saladeprensa/boletines/2025/immex/immex2025_02.pdf |
| IMMEX employment | 3.23M (Dec 2024) | Depth of export-manufacturing labor base; wage and skills competition signal in key corridors. | https://www.inegi.org.mx/contenidos/saladeprensa/boletines/2025/immex/immex2025_02.pdf |
| Aerospace exports | ~$10.7B (2024) | Higher-complexity manufacturing growth signal in a defined cluster industry. | https://www.trade.gov/country-commercial-guides/mexico-aerospace |
| Mexico FDI inflows | ~$36.9B (2024) | Capital inflow momentum supporting industrial buildout (reporting reference). | https://elpais.com/mexico/2025-02-21/la-economia-de-mexico-crecio-12-en-2024-su-peor-desempeno-desde-2020.html |
| Buyer | Seller / target | Why it matters for Mexican manufacturing | Announced | Deal value | Source URL |
|---|---|---|---|---|---|
| Cabot Corporation | Mexico Carbon Manufacturing (MXCB), from Bridgestone | Industrial materials capacity expansion in Mexico (Altamira-linked footprint). | 2025-08-04 | Not disclosed | https://investor.cabot-corp.com/news-releases/news-release-details/cabot-corporation-acquire-mexico-carbon-manufacturing-sa-de-cv |
| Specialized Packaging Group | ArkPack de México (Monterrey assets) | Packaging capacity near a major industrial hub; packaging is a frequent ramp bottleneck. | 2025-07-29 | Not disclosed | https://www.prnewswire.com/news-releases/specialized-packaging-group-expands-into-monterrey-mexico-with-acquisition-of-arkpack-de-mexicos-monterrey-assets-302515291.html |
| UPS | Estafeta (agreement announced; later terminated) | Signals strategic value of Mexico-linked logistics networks even when specific deals don’t close. | 2024-07-22 | Not disclosed | https://about.ups.com/us/en/newsroom/press-releases/our-strategy/ups-to-acquire-estafeta–providing-powerful-global-logistics-sol.html |
| Scenario | Program life (years) | CAC (one-time) | Annual revenue | EBITDA margin (assumed) | Annual EBITDA | LTV (EBITDA-based, undiscounted) | LTV:CAC | CAC payback (months) |
|---|---|---|---|---|---|---|---|---|
| Conservative | 3 | $150,000 | $2,500,000 | 10% | $250,000 | $750,000 | 5.0x | 7.2 |
| Base Case | 5 | $150,000 | $2,500,000 | 10% | $250,000 | $1,250,000 | 8.3x | 7.2 |
| Upside | 7 | $150,000 | $2,500,000 | 10% | $250,000 | $1,750,000 | 11.7x | 7.2 |
| Segment | ERP | MES | QMS | CRM | CPQ | Predictive Maintenance | Computer Vision QA | AI Forecasting |
|---|---|---|---|---|---|---|---|---|
| Automotive Tier Suppliers | 3 | 3 | 3 | 2 | 2 | 2 | 2 | 2 |
| Aerospace Manufacturers | 3 | 2 | 3 | 2 | 1 | 2 | 3 | 2 |
| Electronics / EMS | 3 | 2 | 2 | 3 | 2 | 2 | 2 | 3 |
| Mid-Market Industrial | 2 | 1 | 2 | 2 | 1 | 1 | 1 | 1 |
| Period | Headline themes |
|---|---|
| 2022 | Supply chain volatility; nearshoring narrative accelerates. |
| 2023 | FDI commitments rise; industrial park expansion; labor tightness emerges. |
| 2024 | Record auto output context; strong FDI inflows; automation pilots scale. |
| 2025–2027 (projection) | Automation deployment grows; Tier 2 consolidation; EV-related supply chain expansion. |
| Ops KPI | What it measures | Why it matters | How to calculate | Good practice target (directional) | Primary owner | Review cadence |
|---|---|---|---|---|---|---|
| On-Time Delivery (OTD) | % shipments delivered on/before promised date | Retention and chargeback risk control | (On-time shipments ÷ total shipments) × 100 | Stable trend up; segment by customer and lane | Logistics / Supply Chain | Weekly |
| First Pass Yield (FPY) | % units passing without rework | Reduces labor cost and schedule volatility | (No-rework good units ÷ total units) × 100 | Improve MoM; isolate by line/shift | Production + Quality | Daily / Weekly |
| Scrap Rate | % material or units scrapped | Direct profit leakage | (Scrap cost ÷ total cost) × 100 or (scrap units ÷ total units) × 100 | Visible trending; top defect drivers attacked | Quality + Operations | Weekly |
| OEE | Availability × Performance × Quality | Bottleneck productivity lens | Standard OEE formula | Focus on constraint first | Operations / Maintenance | Daily / Weekly |
| Quote Turnaround Time | RFQ receipt to quote sent | Impacts win rate | Average time from RFQ to quote | SLA by complexity tier | Sales Engineering | Weekly |
| Corrective Action Cycle Time | Time to close corrective actions | Signals quality maturity | Avg days from issue to verified closure | Clear SLAs; verify effectiveness | Quality | Weekly / Monthly |
| Cash Conversion Cycle (CCC) | DIO + DSO − DPO | Liquidity predictor | CCC = DIO + DSO − DPO | Stable or improving; investigate spikes | Finance + Supply Chain | Monthly |
| Constraint Utilization | Load on true bottleneck resource | Prevents overbooking and late shipments | (Used hours ÷ available hours) × 100 (for constraint) | Operate with buffer; protect constraint | Ops Planning | Weekly |
| Function | Strategic move | Core objective | Business impact | Execution priority | Key KPIs |
|---|---|---|---|---|---|
| Finance | Program-level profitability modeling (quote-to-cash) | Ensure growth drives margin | Prevents underpriced ramps; improves margin quality | Immediate | Program margin %, payback period, win rate by tier |
| Finance | Working capital tightening during ramps | Protect liquidity | Reduces cash strain and expediting | High | CCC, DSO, inventory turns, premium freight % |
| Finance | Capex allocated via constraint economics | Maximize throughput ROI | Expands effective capacity without overbuilding | High | Constraint OEE, contribution per constrained hour |
| Marketing | Proof-driven digital infrastructure | Win before first sales call | More qualified RFQs; shorter sales cycles | Immediate | Qualified inbound RFQs, conversion rate |
| Marketing | Targeted ABM with relevance-first outreach | Focus on high-fit programs | Better pipeline quality and CAC efficiency | High | Target account engagement, pipeline influenced |
| Marketing | Supplier quality starter kit | De-risk qualification early | Higher audit-to-award conversion | Medium | Download-to-RFQ rate, audit-to-award conversion |
| Operations | Border-resilient logistics playbook | Stabilize cross-border execution | Higher OTD; fewer premium freight events | Immediate | OTD by lane, border dwell time, premium freight % |
| Operations | COPQ reduction with fast feedback loops | Protect margin at the source | Lower scrap/rework; fewer chargebacks | High | FPY, scrap %, COPQ, 8D cycle time |
| Operations | Automation prioritized at constraint points | Increase output without linear labor growth | Boosts throughput and ramp stability | High | OEE, PPM, downtime, labor hours per unit |
Source List
- World Bank: Mexico GDP (current US$)
- World Bank: Manufacturing value added (% of GDP), Mexico
- INEGI: Exports by State (ETEF)
- INEGI: IMMEX indicators bulletin (Nov/Dec 2024 context)
- Secretaría de Economía (gob.mx): IED 4T 2024 (FDI report, annual total)
- U.S. International Trade Administration: Mexico Automotive Industry
- U.S. International Trade Administration: Mexico Aerospace
- Safran: Mexico country profile
- Cabot: Acquisition announcement (Mexico Carbon Manufacturing)
- PR Newswire: SPG acquisition of ArkPack de México assets
- UPS: Estafeta acquisition announcement (later terminated)
- PW&Co: Manufacturing M&A Industry Report (Q4 2024) – mid-market comps and subsector multiples
- McKinsey: B2B omnichannel growth insights (2024)
- Gartner: B2B buyer preference for rep-free experiences (press release)
- Forrester: 2024 B2B marketing budget benchmarks overview (report page)
Notes on data limitations and how to interpret the numbers
- ETEF exports vs national exports
ETEF attributes exports to the state-of-origin and may not match Mexico’s national export totals exactly. Use it for geographic concentration and growth by state, not as a replacement for the national trade balance series. Source: INEGI ETEF documentation page. (INEGI) - IMMEX counts are a strong proxy, not the entire manufacturing workforce
IMMEX establishment and employment figures reflect the program footprint, which is closely tied to export manufacturing, but not all manufacturing activity in Mexico runs through IMMEX. - Deal tables are illustrative, not comprehensive league tables
Publicly disclosed, Mexico-relevant industrial deals are unevenly reported. For a complete “top 10 deals” view with consistent filters and values, paid databases are typically required. - LTV:CAC in manufacturing is a modeling translation
Manufacturing doesn’t naturally report SaaS-style LTV and CAC. The table is a scenario model at the program level to support internal decision discipline, not a claim of sector averages. - Multiples vary sharply by subsector, size, and profitability
EV/EBITDA and EV/Revenue move with growth expectations, customer concentration, margin quality, and cyclicality. Mid-market comps are helpful for range-setting, not valuation conclusions.
Disclaimer: The information on this page is provided by Manufacturing.co for general informational purposes only and does not constitute financial, investment, legal, tax, or professional advice, nor an offer or recommendation to buy or sell any security, instrument, or investment strategy. All content, including statistics, commentary, forecasts, and analyses, is generic in nature, may not be accurate, complete, or current, and should not be relied upon without consulting your own financial, legal, and tax advisers. Investing in financial services, fintech ventures, or related instruments involves significant risks—including market, liquidity, regulatory, business, and technology risks—and may result in the loss of principal. Manufacturing.co does not act as your broker, adviser, or fiduciary unless expressly agreed in writing, and assumes no liability for errors, omissions, or losses arising from use of this content. Any forward-looking statements are inherently uncertain and actual outcomes may differ materially. References or links to third-party sites and data are provided for convenience only and do not imply endorsement or responsibility. Access to this information may be restricted or prohibited in certain jurisdictions, and Manufacturing.co may modify or remove content at any time without notice.